E
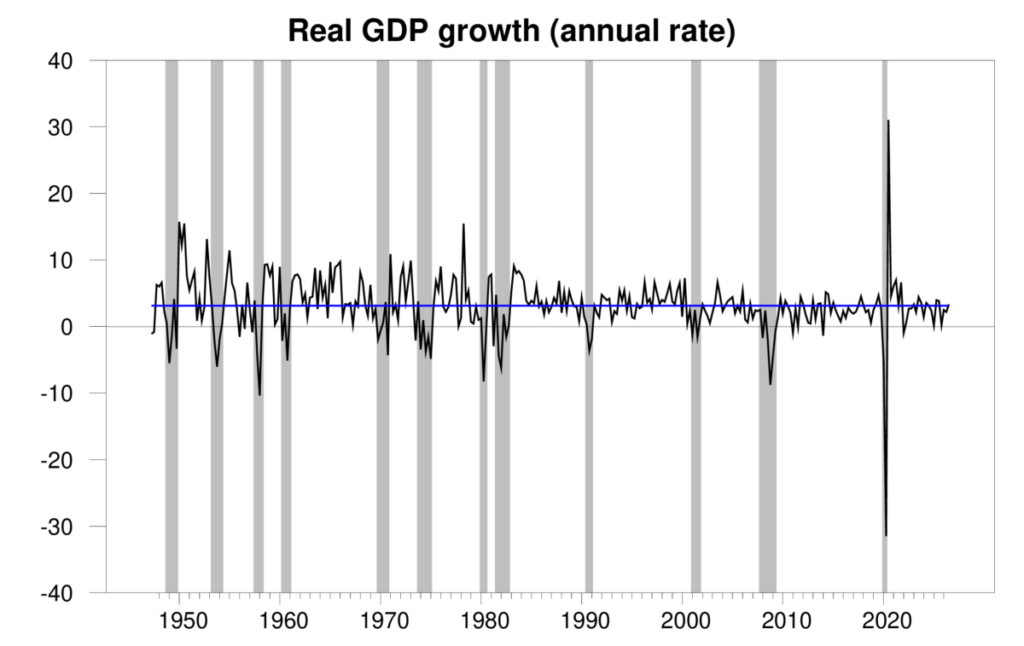
The Bureau of Economic Analysis announced today that seasonally adjusted U.S. real GDP grew at a 3.4% annual rate in the third quarter. That is a little above the historical average growth of 3.1% and better than the numbers we’d been seeing over the last three quarters. Quarterly real GDP growth at an annual rate, 1947:Q2-2026:Q3, with the historical average since 1947 (3.1%) in blue. Calculated as 400 times the difference in the natural log of real GDP from the previous quarter. Today’s GDP…
E
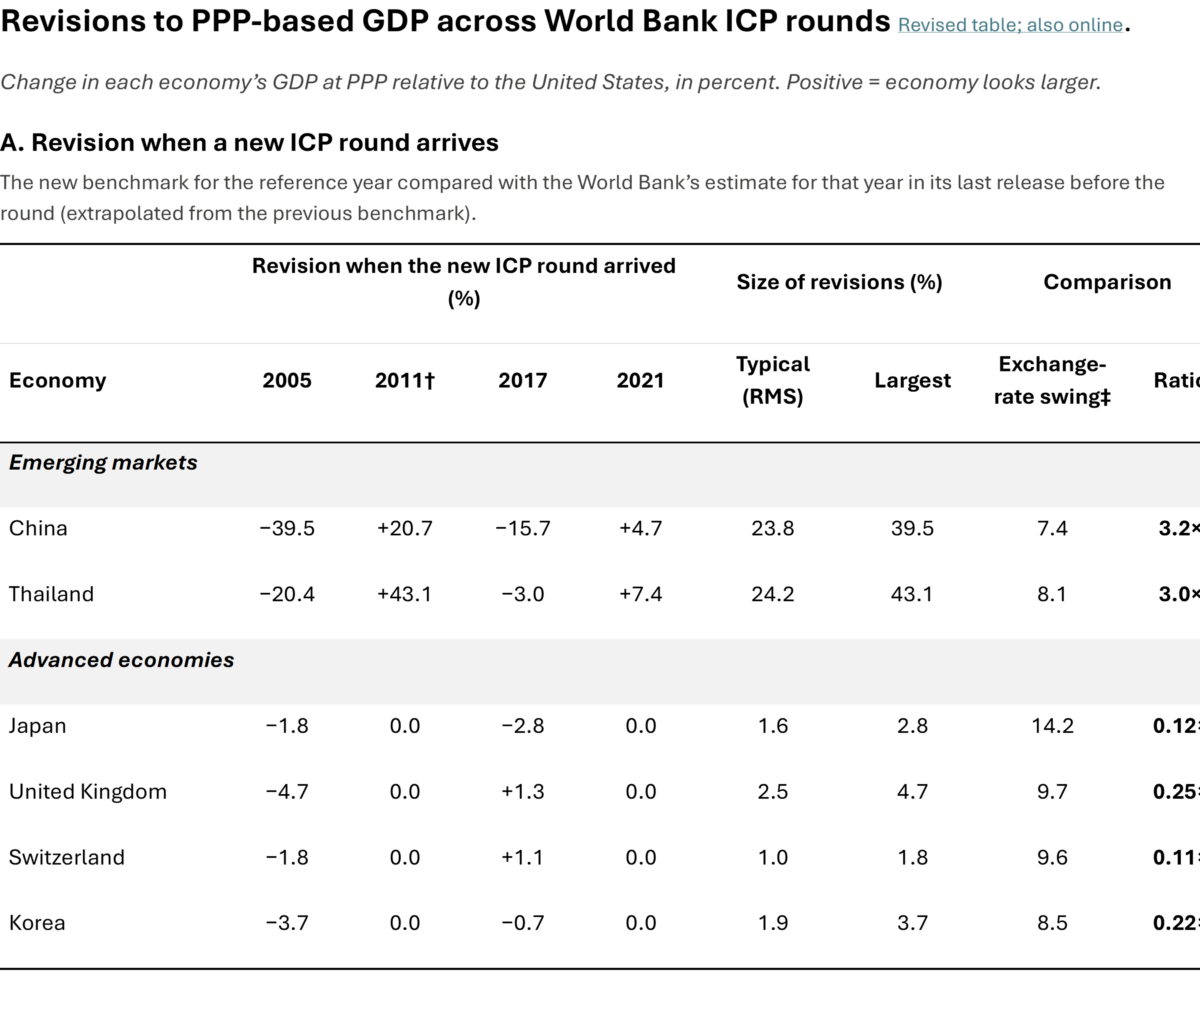
Today, we present a guest post written by Jeffrey Frankel, Harpel Professor at Harvard’s Kennedy School of Government, and formerly a member of the White House Council of Economic Advisers. A shorter version was published in Project Syndicate. Thanks are due Sohaib Nasim for excellent research assistance. Oct. 29, 2026 — Paul Krugman gave a talk last month at an ECB research conference where the subject was Geoeconomics, the weaponization of economic power for geopolitical ends. China’s ability…
E
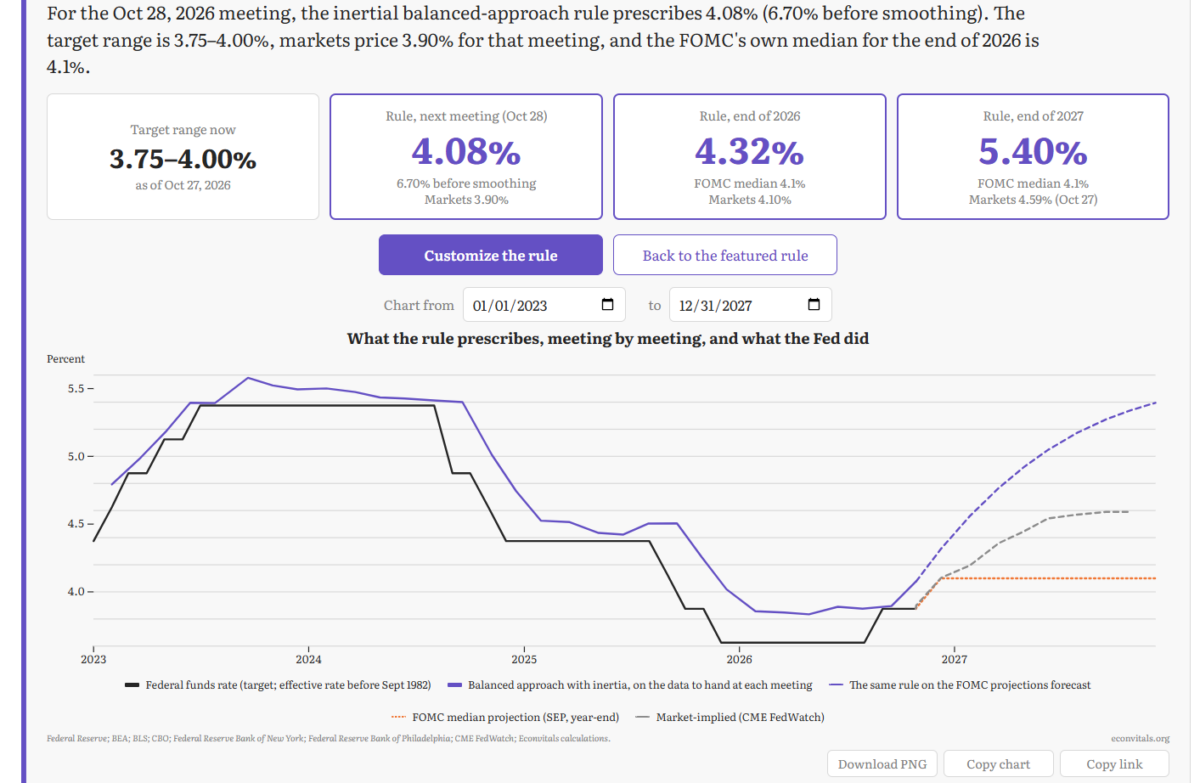
Two voting members of the FOMC dissented in favor of raising rates. Some context for why that stance might make sense, from Jason Furman’s EconVitals Taylor rule utility. Source: EconVitals, accessed 10/28/2026. The implication that current rates are too low vis a vis the Taylor rule is general; here’s the Atlanta Fed’s Taylor rule app as of today: Source: Atlanta Fed, accessed 10/28/2026.
E
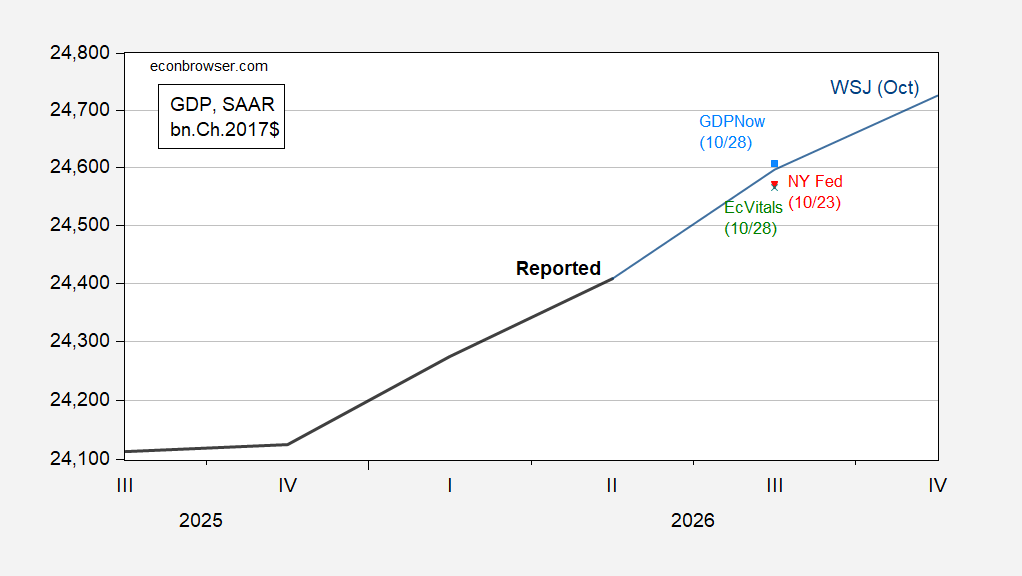
GDP growth nowcasted as solid; nowcasted “core GDP” goes gangbusters. Advance release to be discussed by Jim tomorrow… Figure 1: GDP (bold black), GDPNow of 10/38 (light blue square), NY Fed nowcast of 10/23 (inverted red triangle), EconVitals nowcast of 10/28 (green +), WSJ mean survey (blue line), all in bn.Ch.2017$ SAAR, calculated by iterating nowcasted growth on 2026Q2 3rd release. Source: BEA, 2026Q2 3rd release, Atlanta Fed, NY Fed, WSJ October survey, EconVitals, and author’s…
E
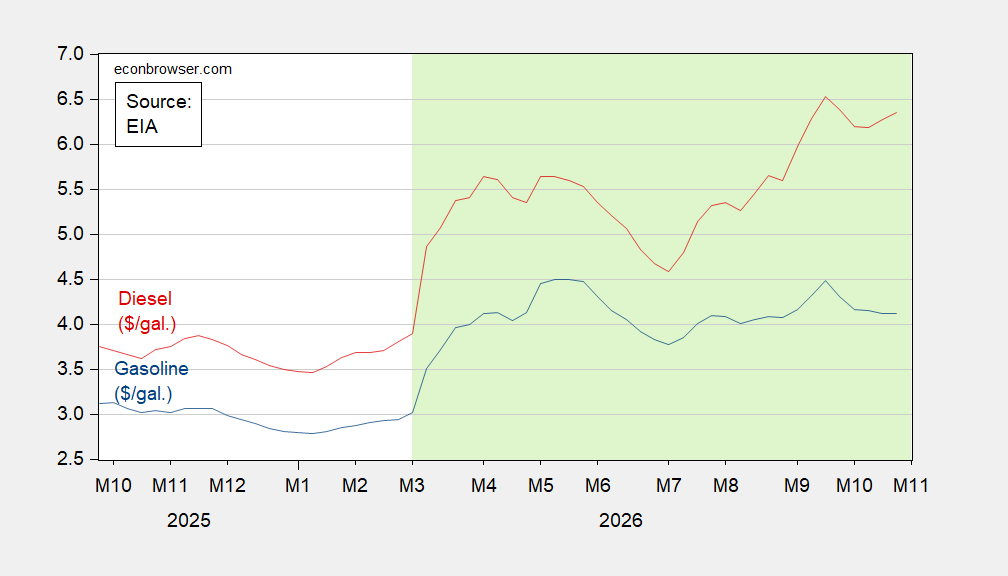
Diesel prices rise again. Figure 1: Regular gasoline (blue), diesel (red), both $/gallon. Source: EIA.
E
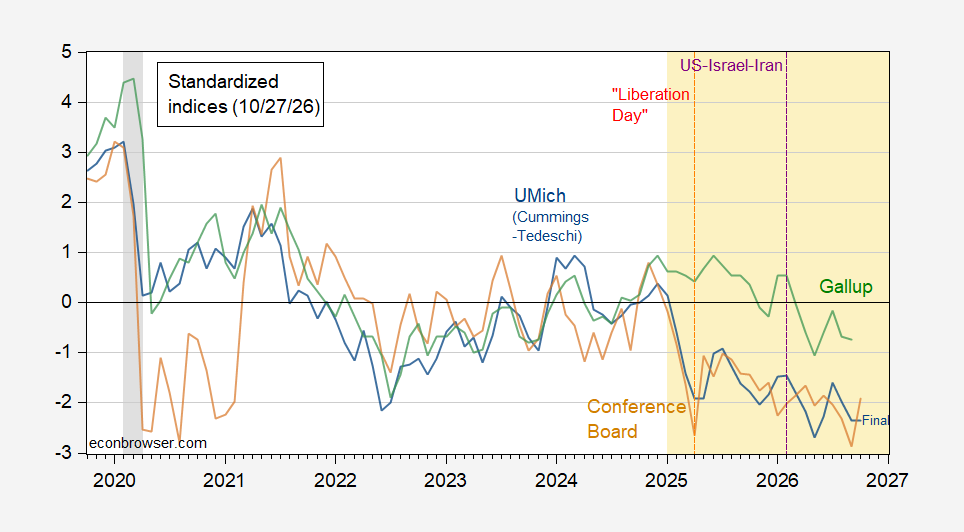
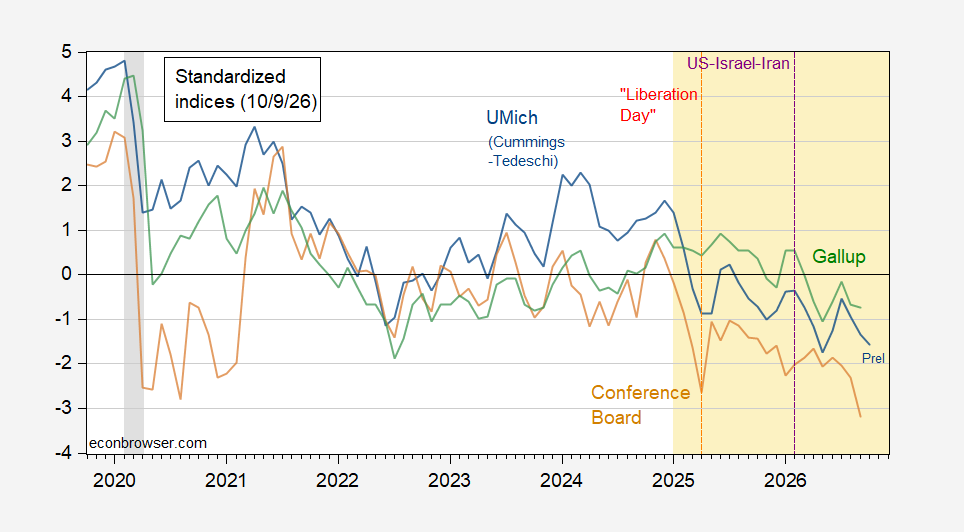
Headlines (Bloomberg) note increase in Conference Board’s Confidence index, for the first time in four months. However, the index remains pretty low, as does Michigan’s final reading on Sentiment. Figure 1: U.Michigan Economic Sentiment, using Cummings Tedeschi adjustment (blue), Conference Board Confidence Index (brown), Gallup Confidence (green), all demeaned and divided by standard deviation 2021M01-2025m02. Red dashed line at “Liberation Day”, purple dashed line at US-Iran war. Source:…
E
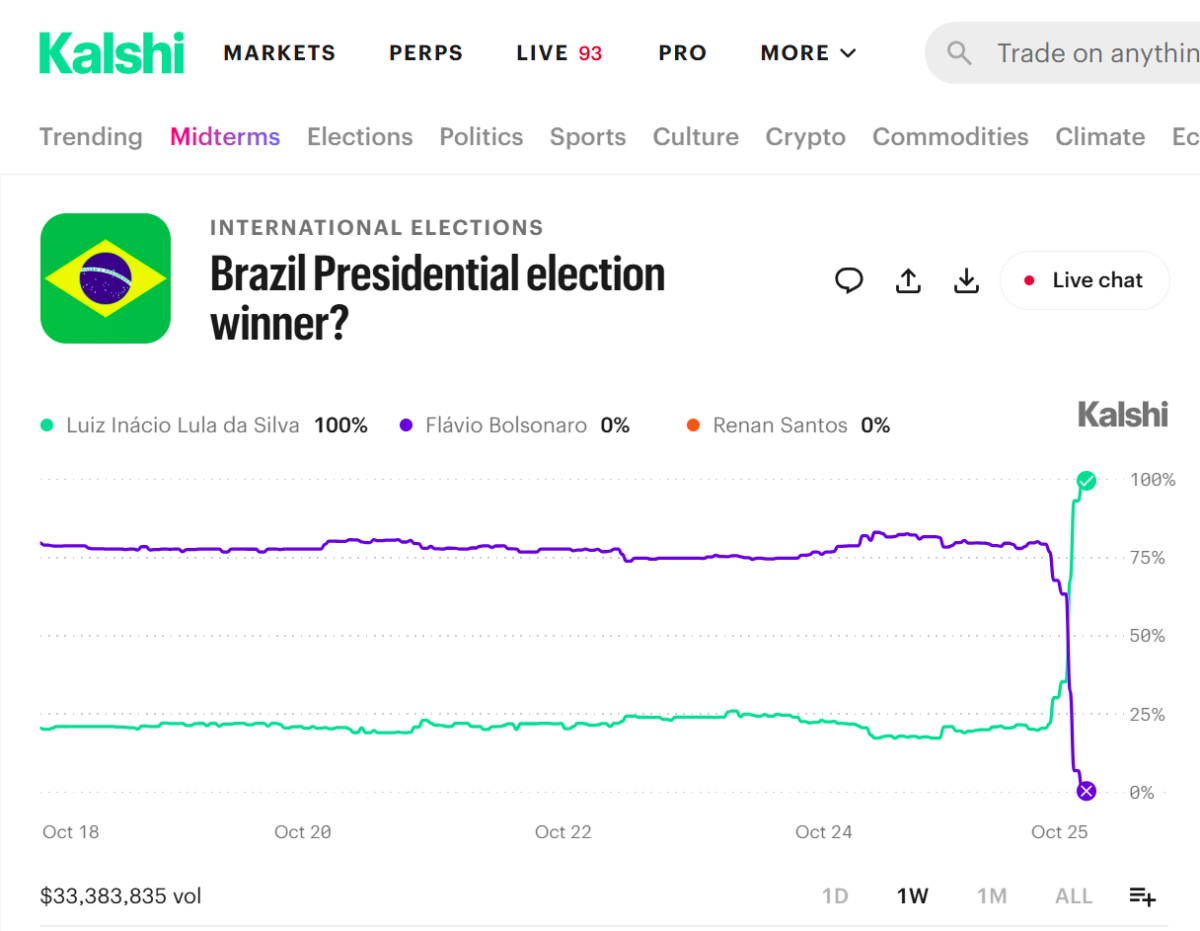
(This is an example for my “financial system” course.) When the outcome differs from expectations in a big way, expect big asset moves.
E
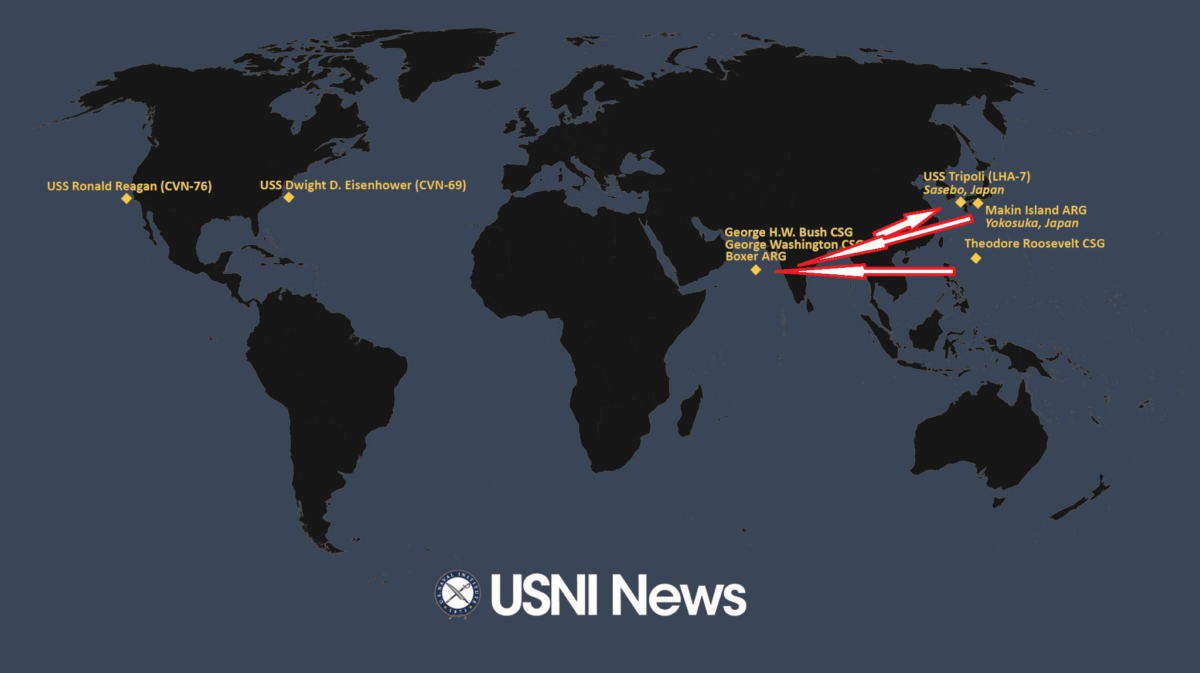
(Per open sources) from USNI: Source: USNI, as edited by author. Arrows indicate USS Theodore Roosevelt CSG to replace George Washington CSG, augmented by USS Makin Island ARG. Of course, who knows what is actually going where, but at least this is the public sourcing. Of more fundamental concern, what will the Administration actually do. This CFR article outlines the options, upsides/downsides. I’ll just note that game theoretic approaches to gaming outcomes rely upon some types of rational…
E
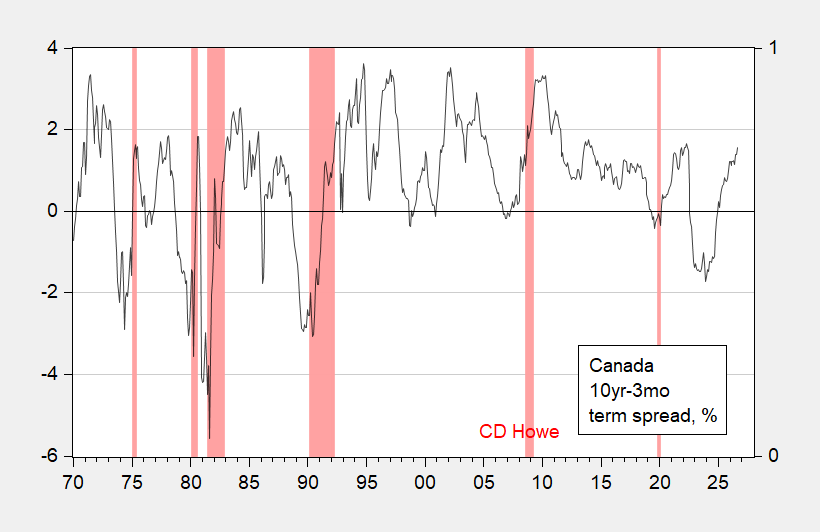
The term spread is positive in Canada through September. But the term spread signaled recession for 2024 (which some had predicted). What can we take from this, regarding recession probabilities? In part, the answer depends on what recessions have been identified. That in turn depends on the interpreter. For Canada, there are at least three: CD Howe, ECRi, and Philip Cross as updated. Here are 10yr-3mo spreads and the respective recession dates (peak-to-trough). Figure 1: Canadian 10yr-3mo…
E
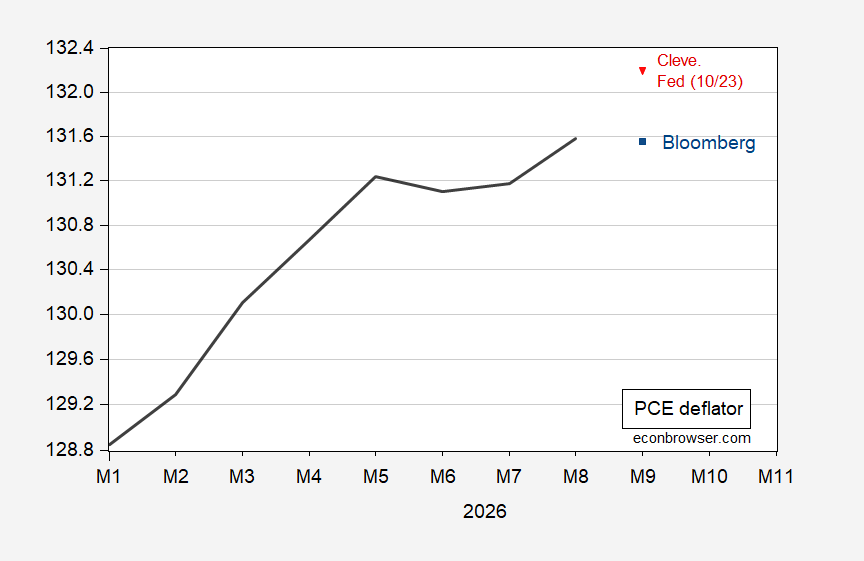
Some divergence from Cleveland Fed nowcast vs. Bloomberg consensus: Figure 1: PCE deflator (black), Cleveland Fed nowcast (red triangle), Bloomberg consensus on 10/25 (blue square). September nowcasts/forecasts using year-on-year changes. Source: BEA, Cleveland Fed, Bloomberg, and author’s calculations.
E
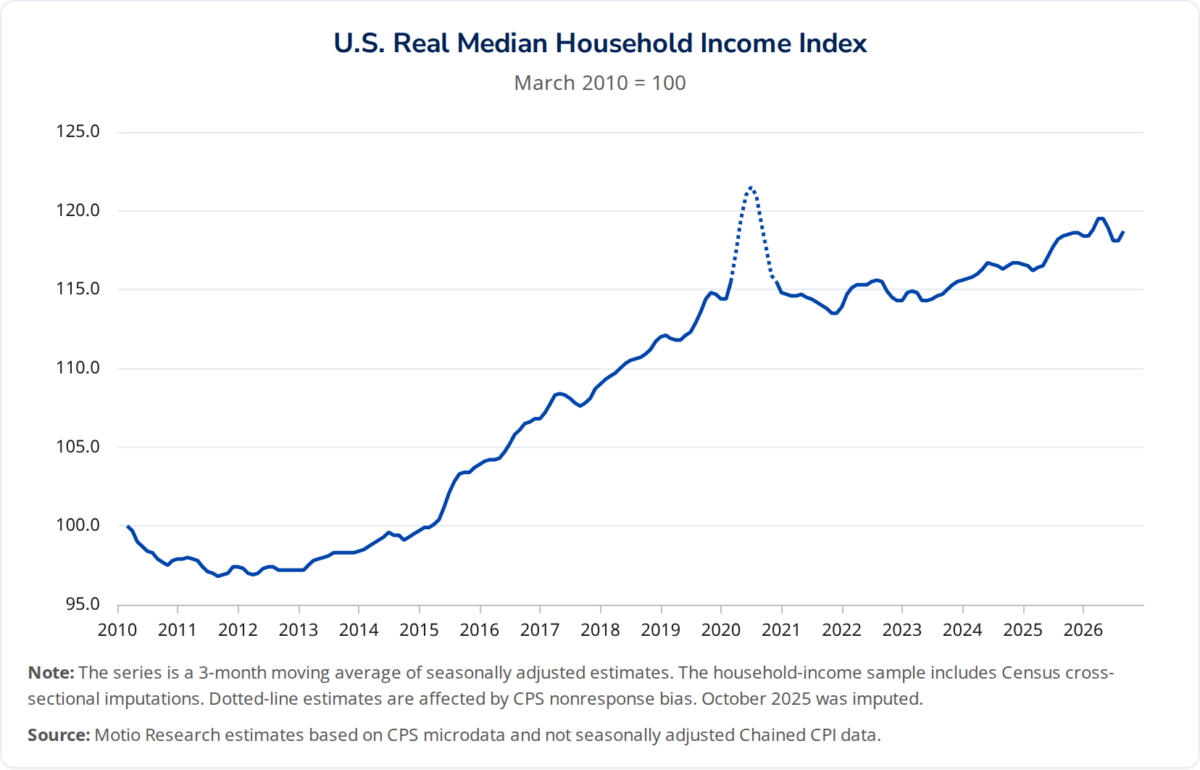
From Motio Research: The methodology and interpretation are described in this guest post by Matías Scaglione and Romina Soria, Motio co-founders. With the recovery in real median household income, the Motio household-income momentum is no [correx 10/26] longer definitively in the candidate contraction region. Motio Research notes the index was: … +0.17 percent in September, from −0.35 percent in August, ending August’s candidate contraction. The household-income cycle remains in a mature…
E
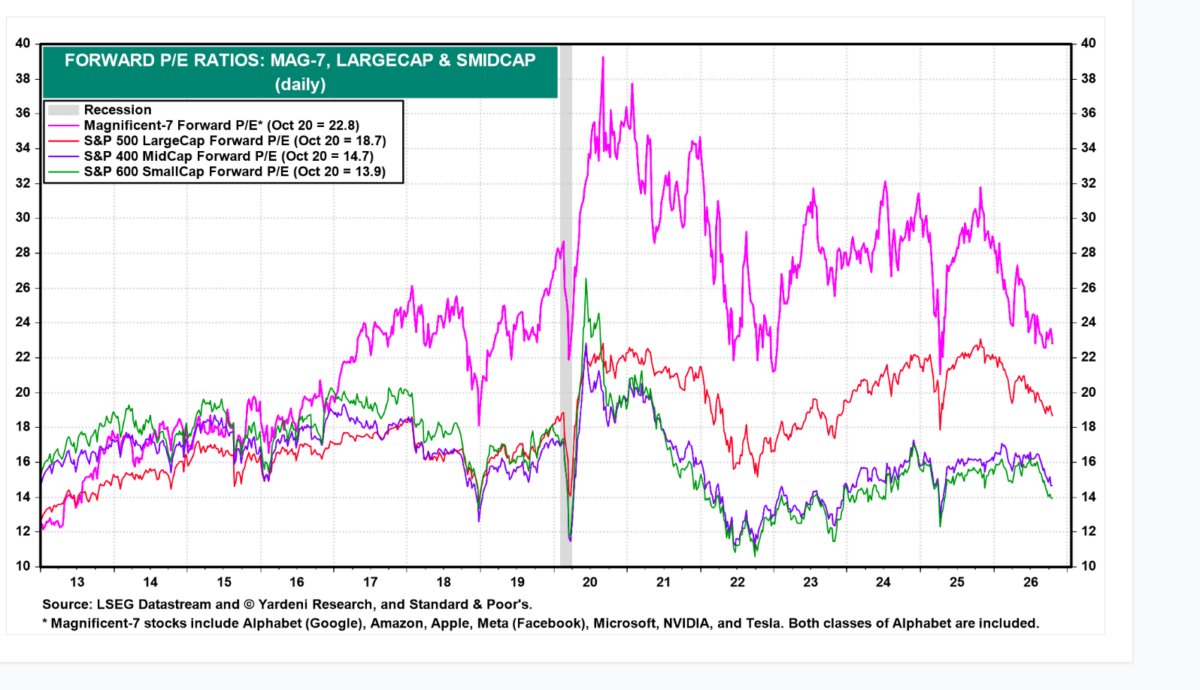
Looking pretty good — although one needs to wonder about analysts’ estimates of forward earnings… Source: Yardeni.com, accessed 22.10.2026. Compare against CAPE:
E
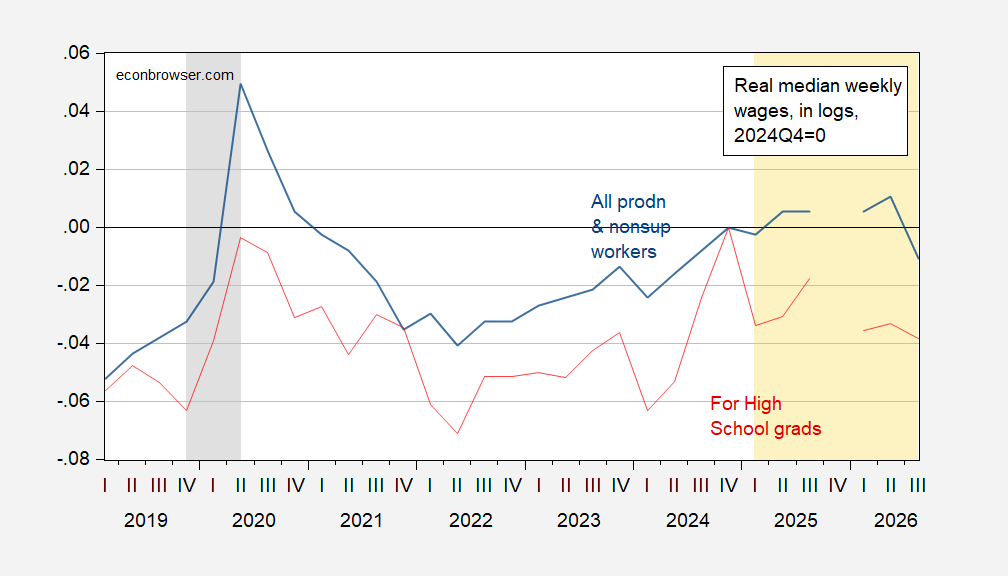
Overall, for HS graduates: Figure 1: Real median weekly wages for all production and nonsupervisory workers (blue), for high school graduates (2nd quartile) (red), in logs 2024Q4=0. NBER defined peak to trough recession dates shaded gray. Source: BLS, NBER, and author’s calculations.
E
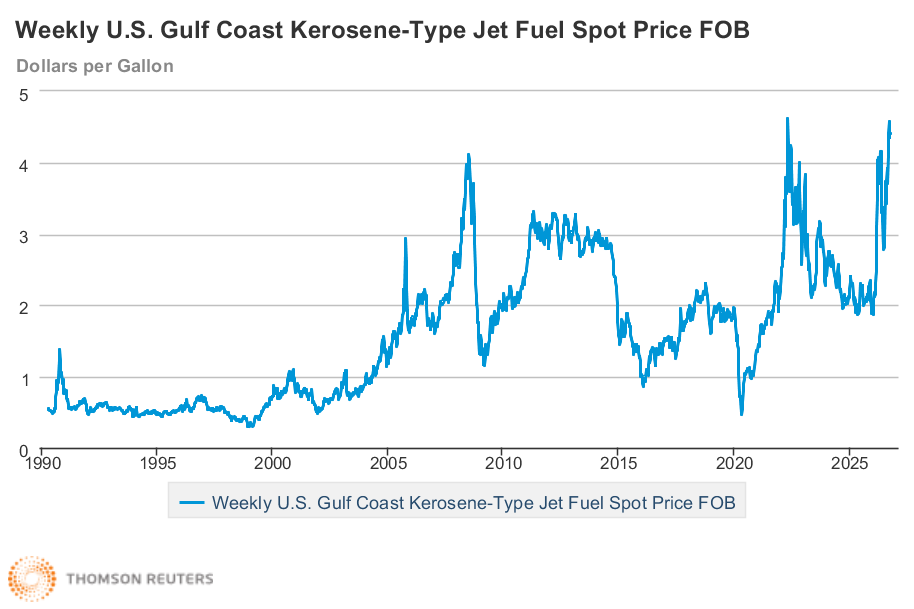
Then, when next you fly; or ship something high value from abroad. From EIA (thru 10/9): Note that the current price is nearing 2022 levels. From IATA (through 10/16):
E
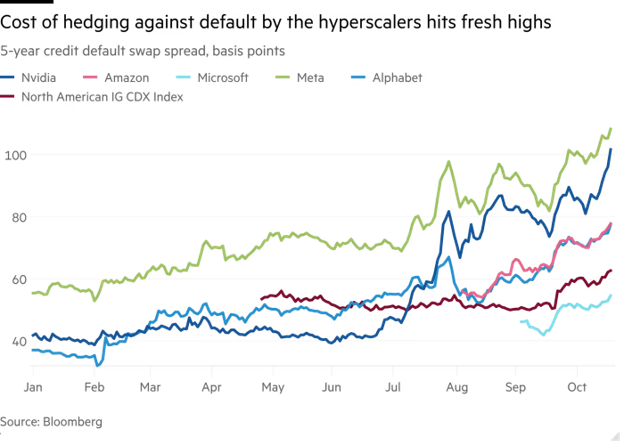
From FT yesterday: These are the large players in the AI boom; consider smaller players also involved in the AI boom. From the Economist: Credit markets are coming for CoreWeave. The price of a five-year bond issued by the “neocloud”, which rents out data-centre capacity for artificial-intelligence models, has fallen by 16% since July. The bond’s yield is now 15%—a level associated with companies in financial distress—up from 10% in July. The price of credit-default swaps offering insurance…
E
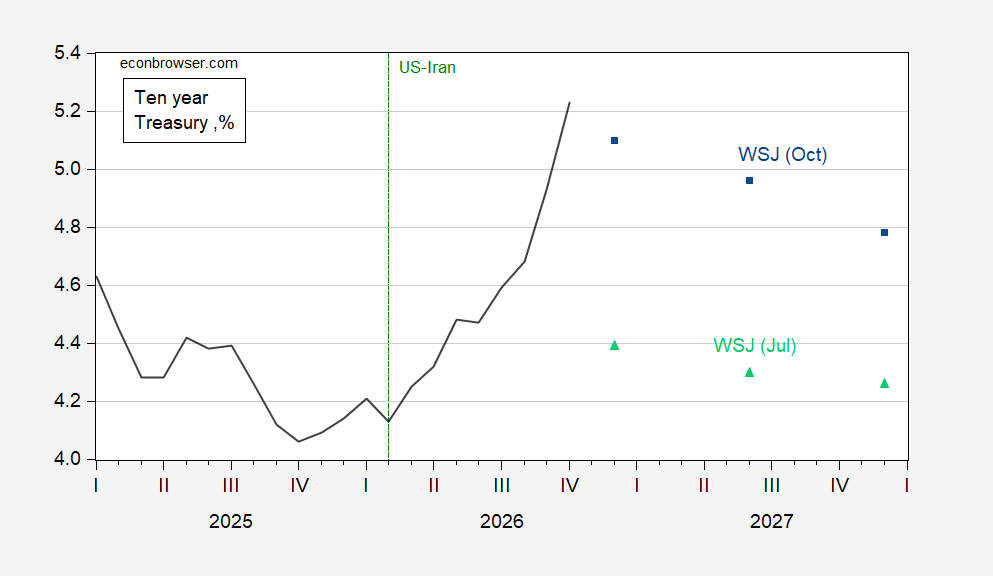
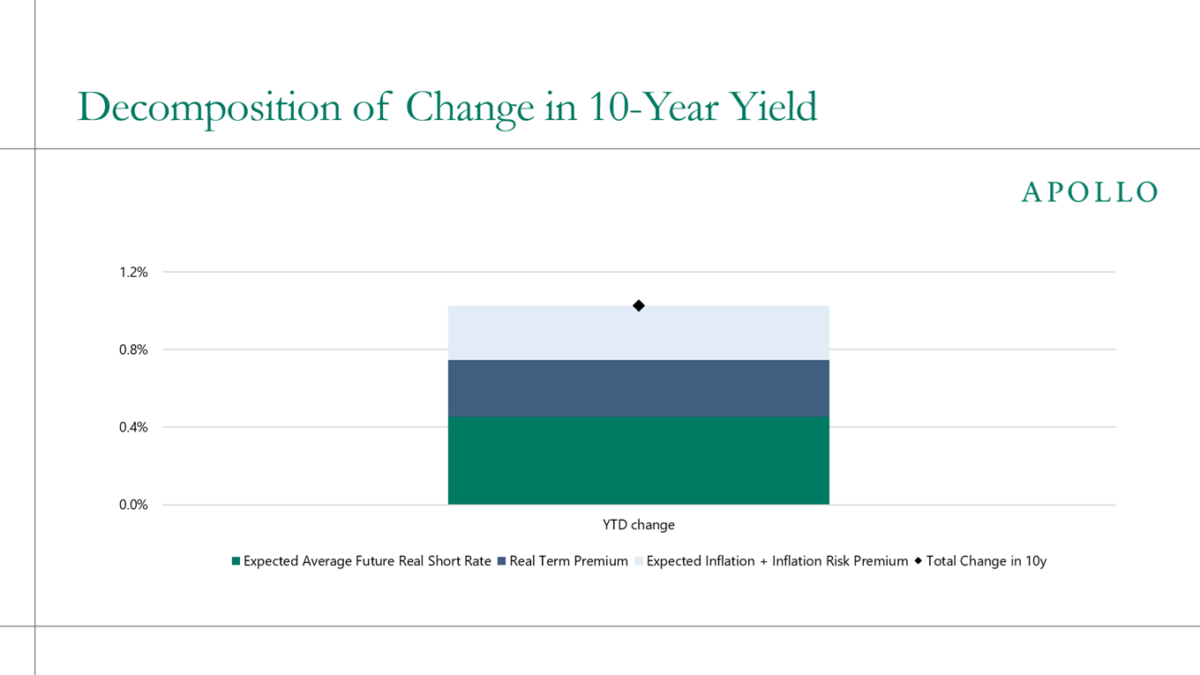
From the October WSJ survey: Figure 1: Ten year Treasury yields (black), October WSJ survey mean (blue square), July WSJ survey mean (light green triangles), all in %. Source: Treasury via FRED, WSJ. A mix of improving growth, new inflationary pressures and concerns about the U.S. fiscal trajectory have pushed bond yields higher since the start of the summer. Many economists said the cocktail has forced them to re-evaluate their assumptions about investors’ demand for Treasurys, whose yields…
E
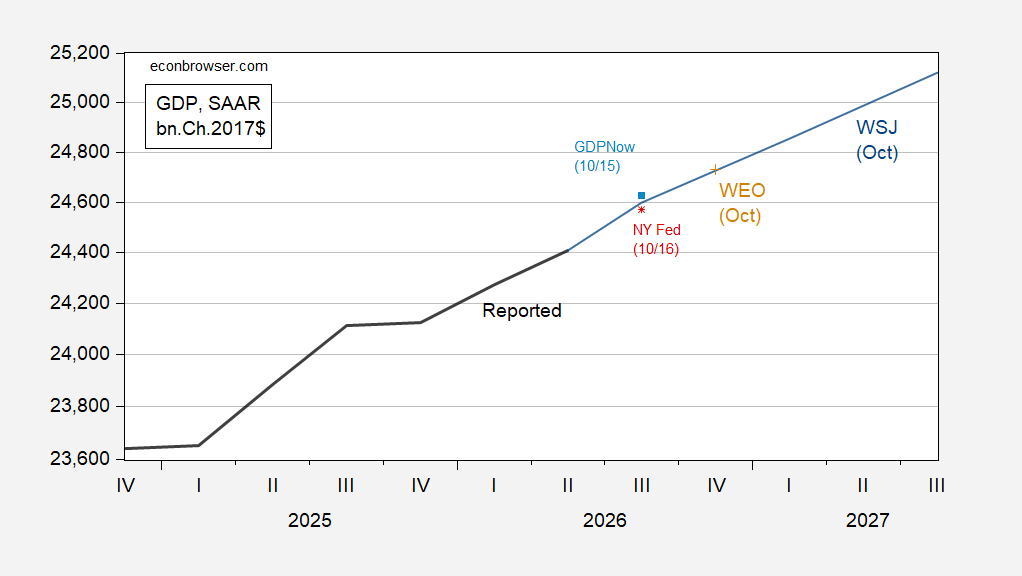
Recent releases: Figure 1: Reported GDP (bold black), October WSJ mean forecast (blue), GDPNow (light blue square), NY Fed nowcast (red *), October WEO (tan +). Source: BEA 2026Q2 3rd release, WSJ, Atlanta Fed, NY Fed, IMF, and author’s calculations.
E
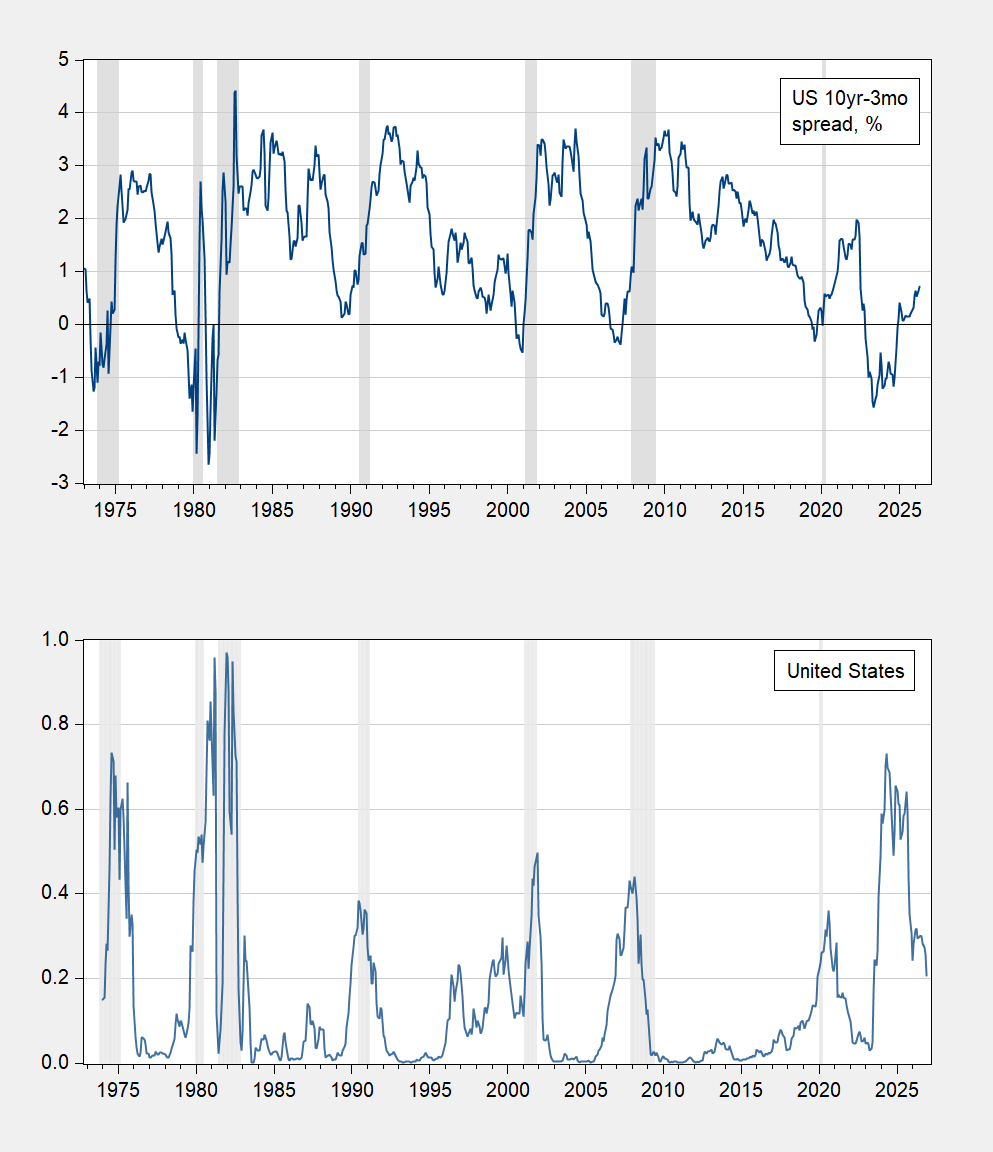
The abstract of a new paper coauthored with Laurent Ferrara, “Missing Recessions: Revisiting the Term Spread’s Predictive Power”: The failure of a recession to materialize in 2024 has forced a reappraisal of the term spread as the most reliable recession predictor for the US. In this paper, we re-evaluate the predictive power of the term spread, and explain the false positive signal in terms of sample specificity, simultaneity, and omitted variables, focusing on the United States, but including…
E
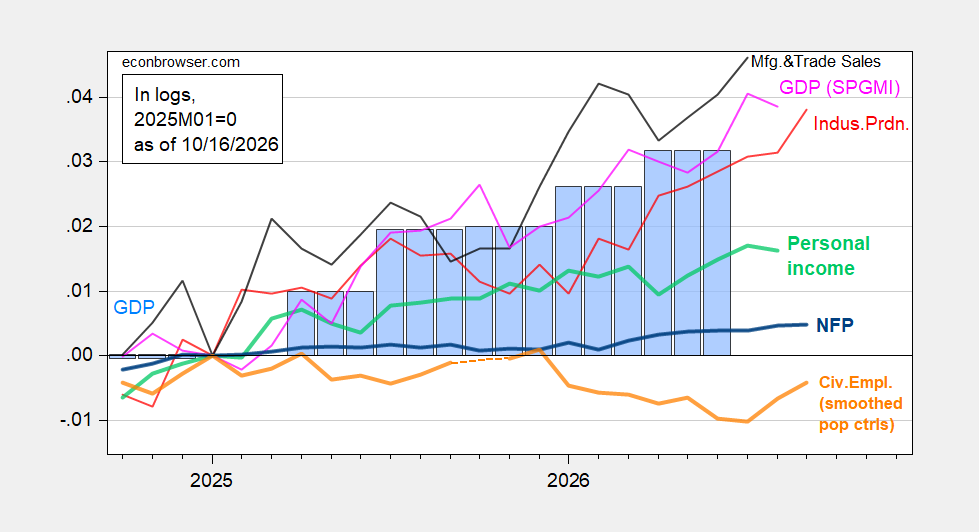
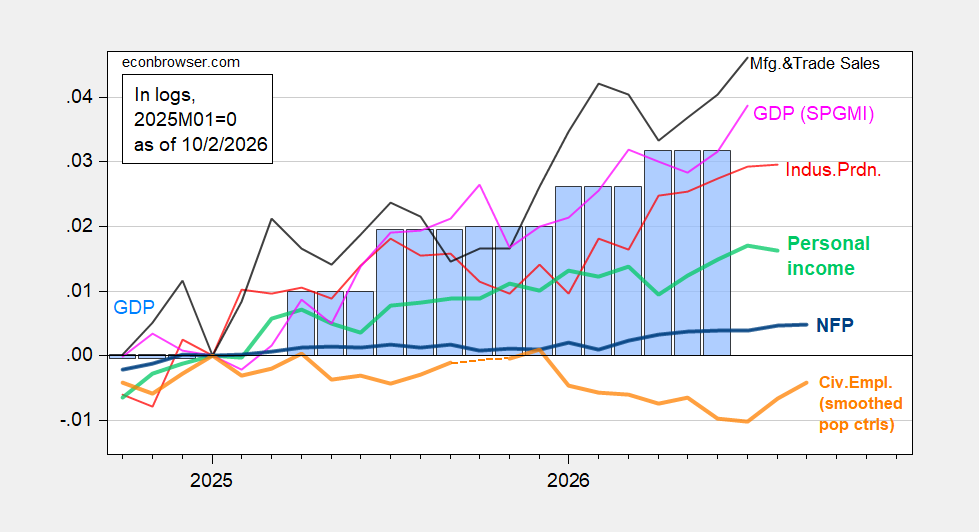
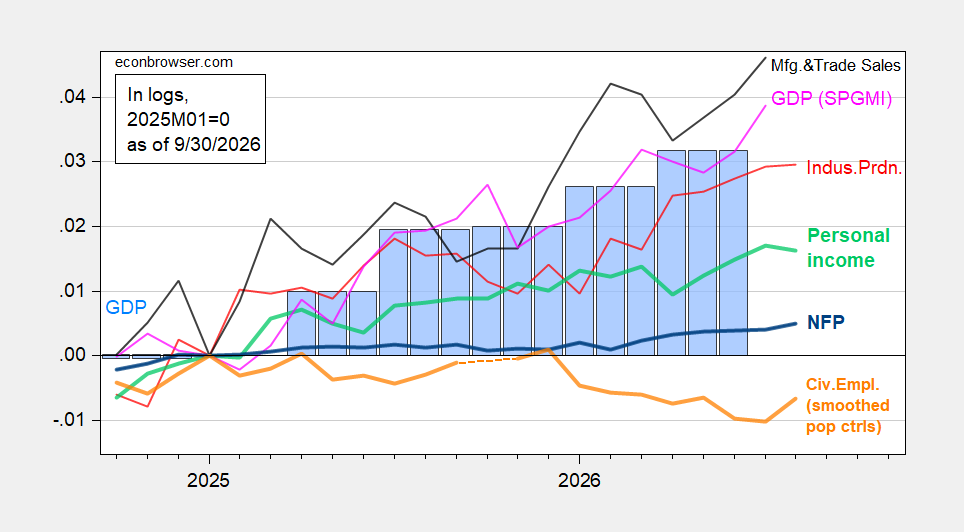
and Monthly GDP for August, manufacturing production. First, NBER BCDC indicators: Figure 1: NFP employment (bold blue), civilian employment with smoothed population controls (bold orange), industrial production (red), personal income excluding current transfers in Ch.2017$ (bold light green), manufacturing and trade sales in Ch.2017$ (black), and monthly GDP in Ch.2017$ (pink), GDP (blue bars), all log normalized to 2025M01=0. Source: BLS via FRED, BLS, Federal Reserve, BEA 2026Q2 3rd release,…
E
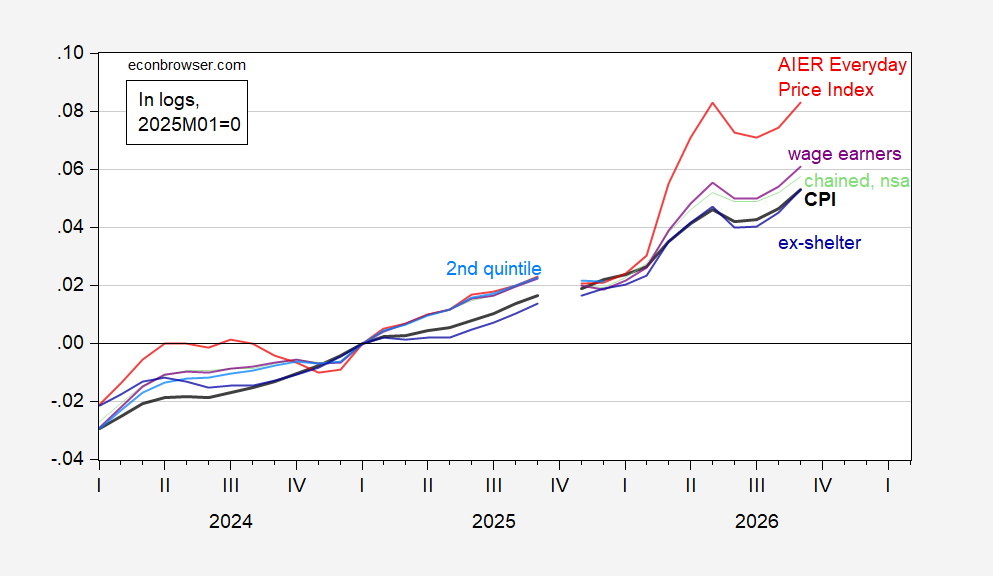
Here are several price indicators for consumers: Figure 1: CPI – all urban (black), CPI wage earners and clerical workers (purple), chained CPI (light green), CPI ex-shelter (blue), AIER Everyday Price Index (red), all in logs 2025M01=0. Source: BLS, AIER, ad author’s calculations. If you feel like everyday expenses are rising faster than the CPI since February, the AIER’s EPI confirms this impression. Real hourly earnings deflated accordingly. Figure 2: Average hourly earnings for production…
E
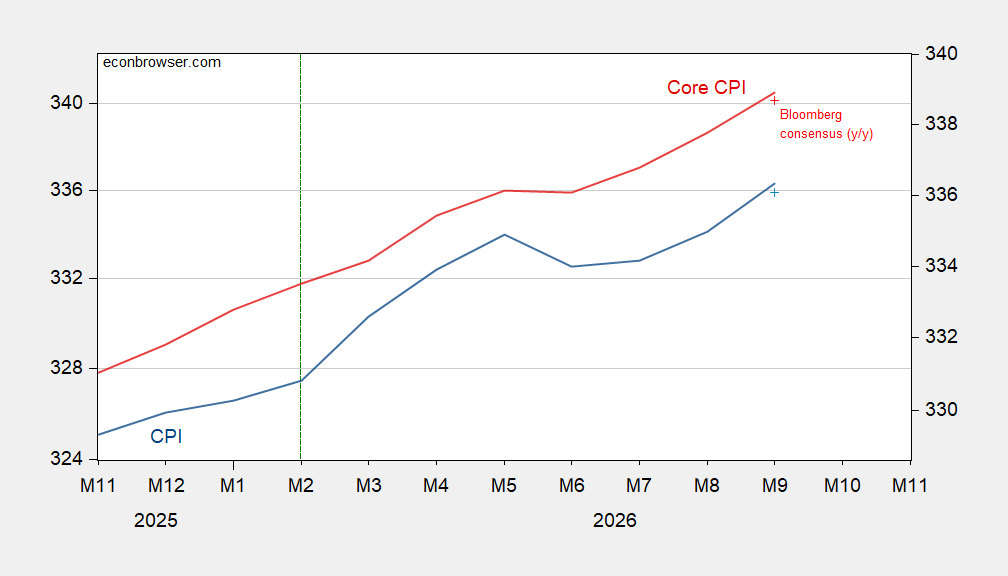
September CPI registered upside surprise: Figure 1: CPI (blue, left log scale), Bloomberg y/y consensus (blue +), core CPI (red, right log scale), Bloomberg y/y consensus (red +). Source: BLS, Bloomberg. The above graph uses y/y consensus; on a m/m (due to rounding), core CPI did not exceed consensus in September, while headline did. Since the Fed targets PCE inflation, it’s useful to consider the implications for PCE. Nowcasts of inflation (orange line for headline, green line for core) picked…
E
From Steve Kamin: Until early in President Donald Trump’s second term, the sensitivity of the dollar to the difference between the slope in the U.S. yield curve and foreign yield curves was mainly positive, as expected. Increases in U.S. 10-year yields relative to those abroad boost the dollar. But immediately after “Liberation Day” in April 2025, when Trump shocked the world with his announcement of “reciprocal” tariffs, that sensitivity turned negative and started fluctuating widely around a…
E
From the Sveriges Riksbank: The Royal Swedish Academy of Sciences has decided to award the Sveriges Riksbank Prize in Economic Sciences in Memory of Alfred Nobel 2026 to Robert E. Hall and Michael Woodford “for microeconomic foundations of macroeconomic stabilisation.” They demonstrated how economic models could be reconstructed to revitalise stabilisation policy. Rather than basing the models on statistical links between macroeconomic variables, such as inflation, production and consumption,…
E
From Bloomberg: Treasury Secretary Scott Bessent named Judy Shelton, a former nominee to the Federal Reserve board and a onetime gold-standard enthusiast, as an adviser to counsel him on issues including China’s financial system. Press release here. Even in these surprising times, I am surprised by this appointment. Dr. Shelton has opined on wage rigidity, on the Soviet economy, on the veracity of government GDP statistics, on currency manipulation, crypto, and gold. But on China’s financial…
E
Preliminary at 46.3 < 47.5 Bloomberg consensus with expectations above consensus, and current conditions below. Here’s a picture of indicators, using the Cummings-Tedeschi adjusted U.Michigan series (all series standardized): Figure 1: U.Michigan Economic Sentiment, using Cummings Tedeschi adjustment (blue), Conference Board Confidence Index (brown), Gallup Confidence (green), all demeaned and divided by standard deviation 2021M01-2025m02. Red dashed line at “Liberation Day”, purple dashed line…
E
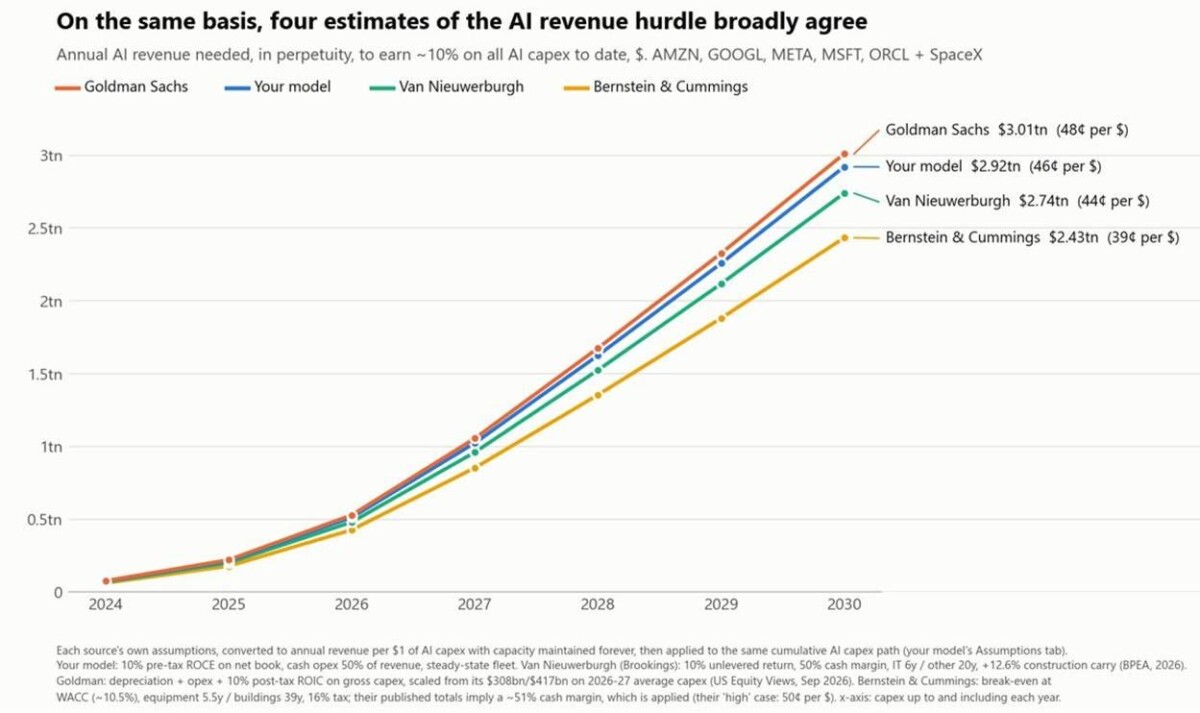
Jared Bernstein, along with others, calculates the revenues needed to rationalize the AI capital investment in place and planned. Source: Callum Williams via J. Bernstein. As Bernstein recounts, this amount of revenue is unlikely to occur within a time frame financial markets are likely to tolerate (i.e., soon). A BPEA paper by Stijn Van Nieuwerburgh on the subject is here. And has been pointed out, financing for these expenditures has been migrating out to more exotic, less transparent, areas…
E
Speaking at a rally in Nebraska (NYT), regarding the Iranians: “They could take out a city,” he said. “Let them take — Let them take out Los Angeles. Let them take out San Diego.” One could take this as just further random ruminations, but it strikes me that the president has in principle access to the entire output of the US intelligence community (even if he doesn’t seemingly heed the warnings). At a time when counterterrorism resources have been redirected to immigration control, or reduced,…
E
Employment downside surprise, +29K vs +89, with cumulative 81K downward revisions to previous two months. Taking into account early benchmark, it’s not changing the picture too much. Figure 1: NFP employment (bold blue), civilian employment with smoothed population controls (bold orange), industrial production (red), personal income excluding current transfers in Ch.2017$ (bold light green), manufacturing and trade sales in Ch.2017$ (black), and monthly GDP in Ch.2017$ (pink), GDP (blue bars),…
E
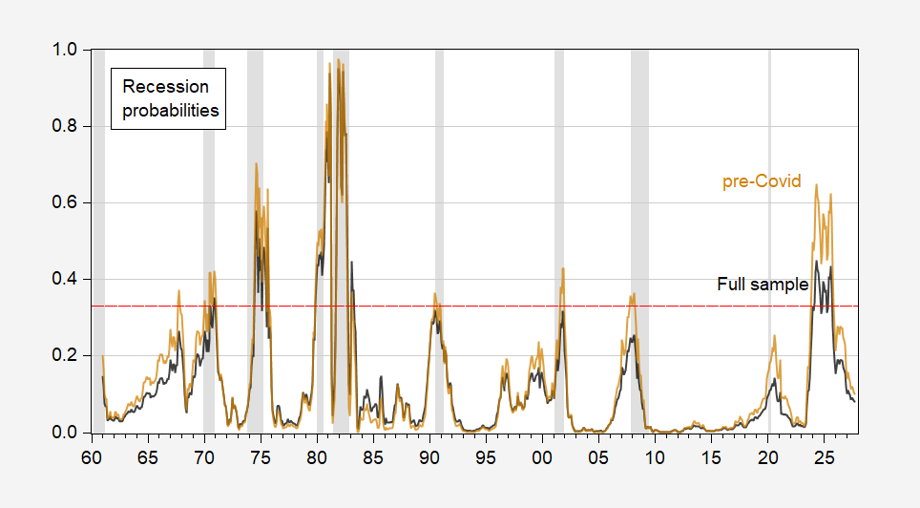
Using a plain vanilla term spread model (spread, short rate), what remains? From notes for tomorrow’s lecture. Figure 1: Estimated recession probabilities from probit on 10yr-3mo term spread, short rate over 1960-2018 (brown), over full sample (black). Red dashed line at 33%. NBER defined peak-to-trough recession dates shaded gray. Source: author’s calculations, NBER. Using a 33% threshold and the pre-2018 sample, the term spread catches every post-1960 recession (taking the pandemic recession…
E
Q2 GDP growth revised up 0.7 ppts, path of personal income ex-transfers up due to revised deflator. Here are the key indicators followed by the NBER’s Business Cycle Dating Committee: Figure 1: NFP employment (bold blue), civilian employment with smoothed population controls (bold orange), industrial production (red), personal income excluding current transfers in Ch.2017$ (bold light green), manufacturing and trade sales in Ch.2017$ (black), and monthly GDP in Ch.2017$ (pink), GDP (blue bars),…