E
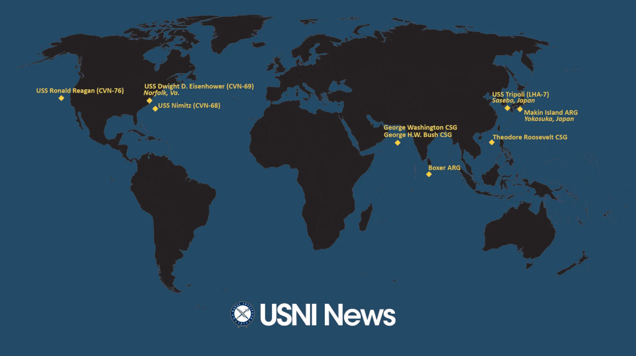
From USNI, based on public sources: Why the concentration of forces? There was, before the midterm elections, talk of an intense round of strikes. However, WSJ notes one downside of going forward. The U.S. intelligence community assesses that Iran has between 1,500 and 2,500 missiles in its arsenal, U.S. officials said, leaving Tehran with significant capacity to attack U.S. and allied targets if all-out war resumes. That is a low-confidence assessment, the officials said, due to the…
E
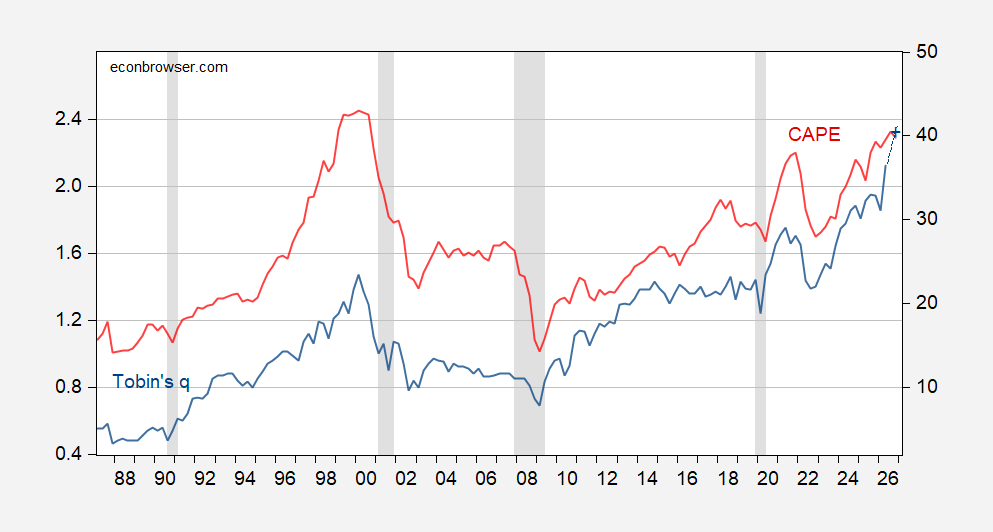
Market vs. Replacement cost, and cyclically adjusted price to earnings ratio: Figure 1: Tobin’s q (blue, left scale), Chang early Nov. estimate for q (blue +), Shiller’s Cyclically Adjusted Price Earnings ratio (red, right scale). Q4 CAPE is data through early November. NBER defined peak-to-trough recession dates shaded gray. Source: Y-Charts, Shiller, Chang/Advisor Perspectives, NBER.
E
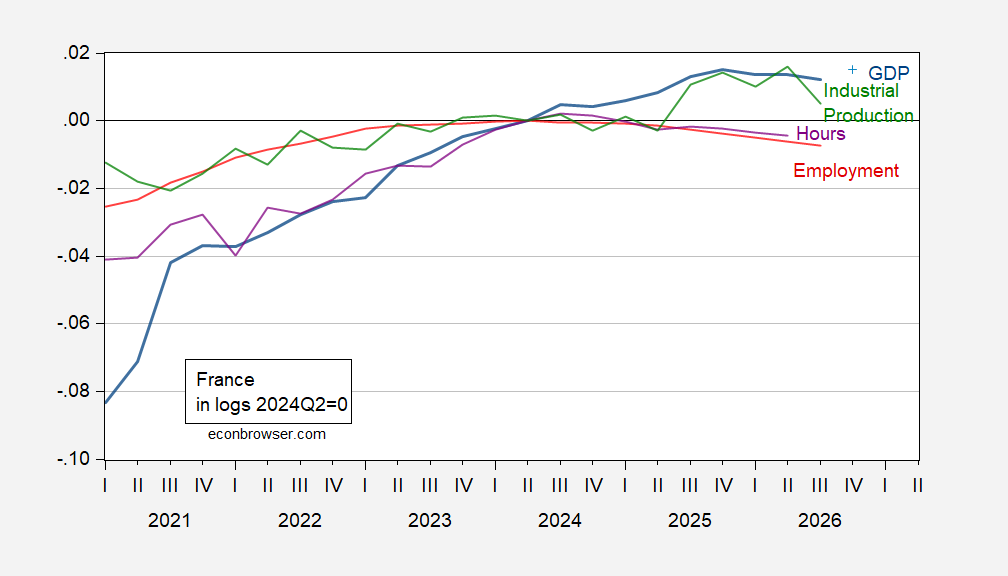
Down for industrial production and employment, hours, while GDP nowcasted to grow (slightly) in Q4. Figure 1: French GDP (blue), French Economic Observatory (OFCE) Nov 10 nowcast (light blue +), industrial production ex-construction (green), employment (red), and hours worked (purple), all in logs 2024Q2=0. Source: OECD via FRED, ECB, OFCE, INSEE, and author’s calculations. Note that GDP has been falling (albeit sometimes very slightly) for three quarters, but industrial production peaks in Q2.…
E
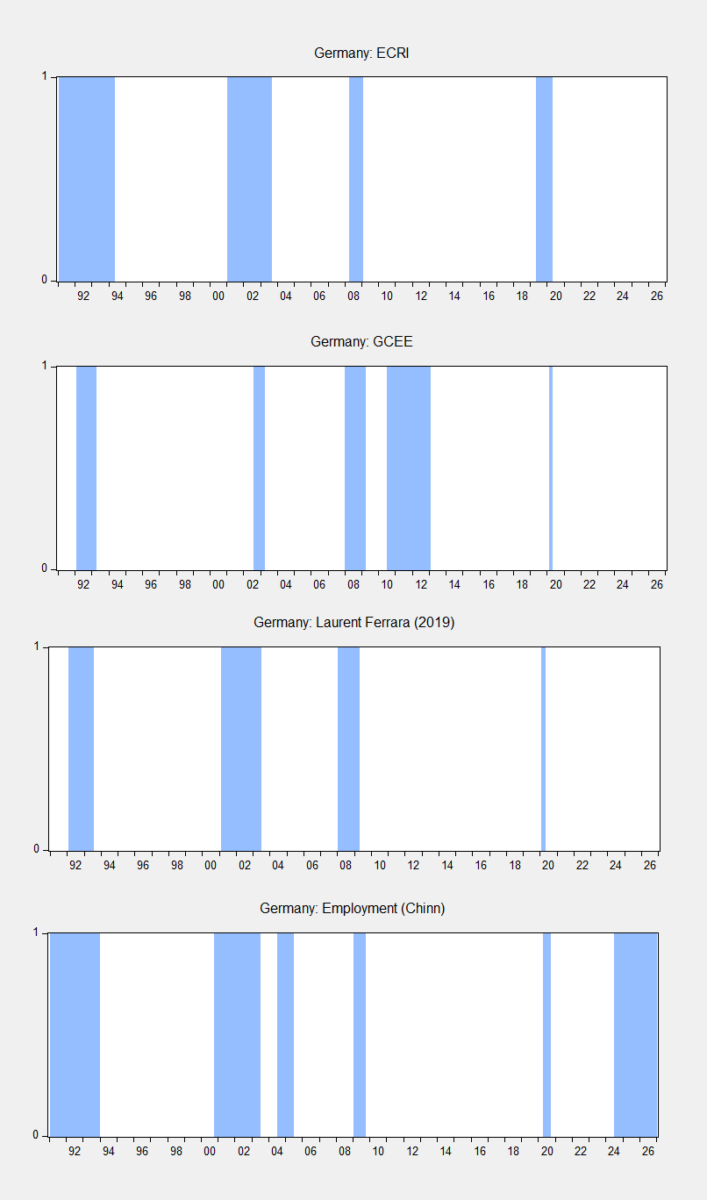
And why 2025-26 was not a recession, despite employment and hours worked declining. ECRI vs. German Council of Economic Experts vs. Ferrara (2019): Figure 1: Top panel: German peak-to-trough recession dates shaded light blue, from ECRI, 2nd panel: from German Council of Economic Experts; 3rd panel: from Laurent Ferrara; bottom panel: based on employment/Chinn. Source: ECRI, GCEE, Ferrara (2019), author’s calculations. The German Council of Economic Experts methodology is provided here. Ferrara…
E
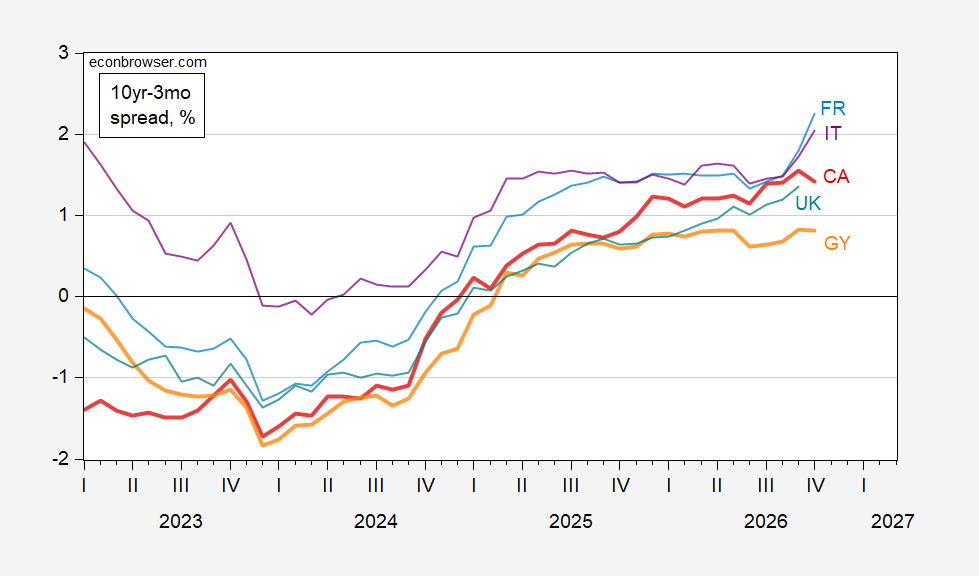
France, Italy rise. UK rose through September. Figure 1: 10 year – 3 month government term spread, for Canada (red), France (light blue), Germany (orange), Italy (purple), UK (teal), all in %. Source: OECD. Historically, this term spread worked better as a predictor of recessions for Canada and Germany (as discussed in Chinn and Ferrara, 2026). For business cycle analysis, it’s typical to assume constant or near zero default risk; for France and Italy, this seems implausible, as illustrated by…
E
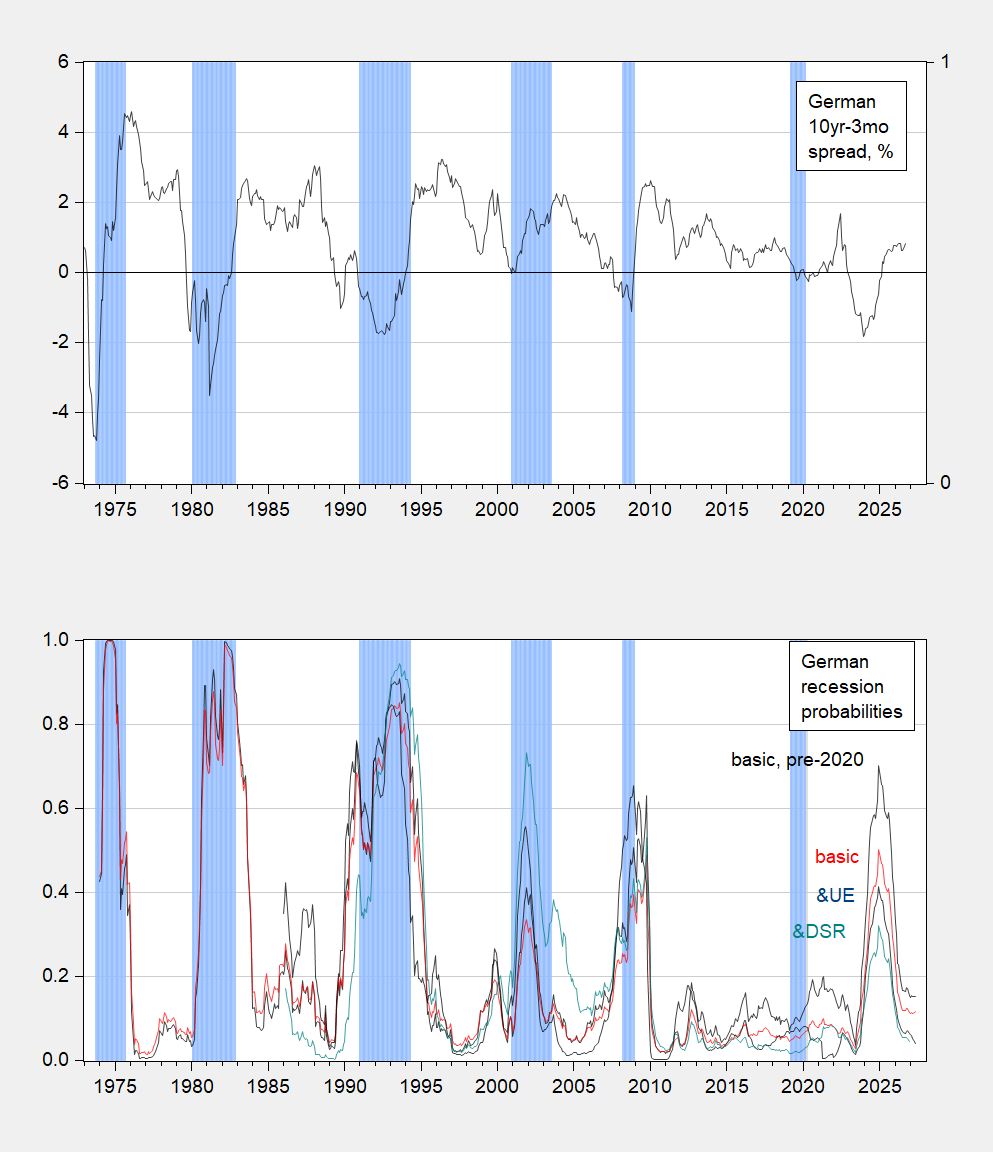
The 10yr-3mo German spread, hitherto a pretty good predictor, inverted at 2022M12. Hitherto a pretty good predictor of German recessions (as labelled by ECRI), the implied probability was 70%, using a plain vanilla spread regression. From Chinn and Ferrara (2026), here are estimated probabilities for a probit regression, estimated up to 2019M12 (black line in bottom panel), corresponding to the 10yr-3mo term spread. Figure 1: Top panel, 10yr-3mo German term spread, % (black); bottom panel,…
E
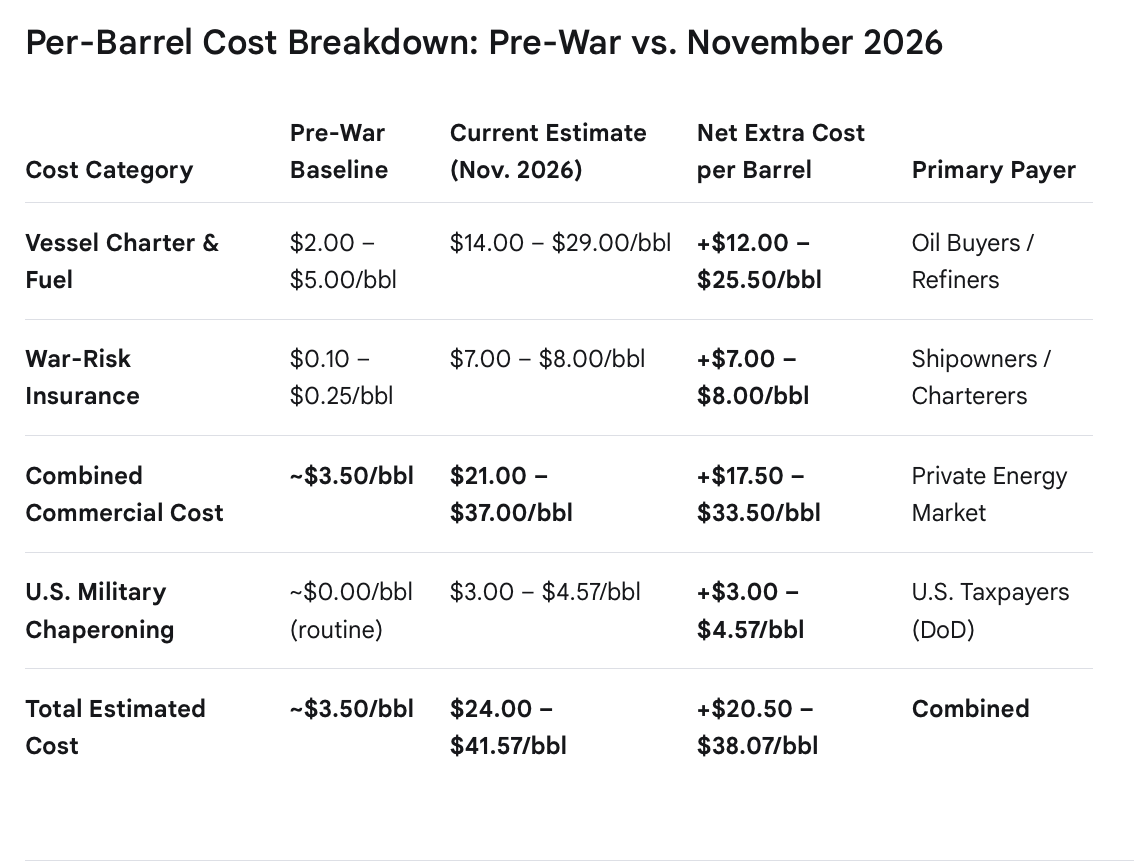
Beyond Brent f.o.b. – from Anthony Chan, who answers a question I’ve long had: From Dr. Chan’s post: The cost of transporting oil through the SOH has increased dramatically since the U.S.-Iran conflict began. What previously cost about $3.50 per barrel in combined commercial transportation and insurance expenses now carries an estimated total cost of $24.00 to $41.57 per barrel when additional commercial and allocated U.S. military expenses are considered. That represents an incremental cost of…
E
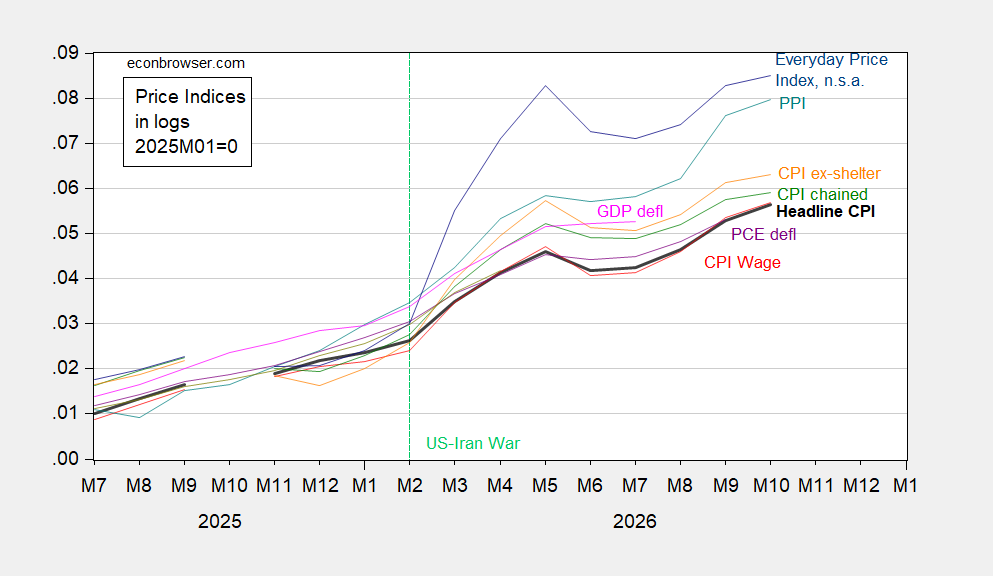
Here is a overall picture, including PPI. Figure 1: CPI (bold black, ) CPI wage (red), CPI chained n.s.a. (green), CPI ex-shelter (orange), PCE deflator (purple), PPI (teal), S&P Global GDP deflator (pink), AIER EPI, n.s.a. (blue), all 2025M01=0, in logs. Source: BLS, BEA, S&P Global, AIER, and author’s calculations.
E
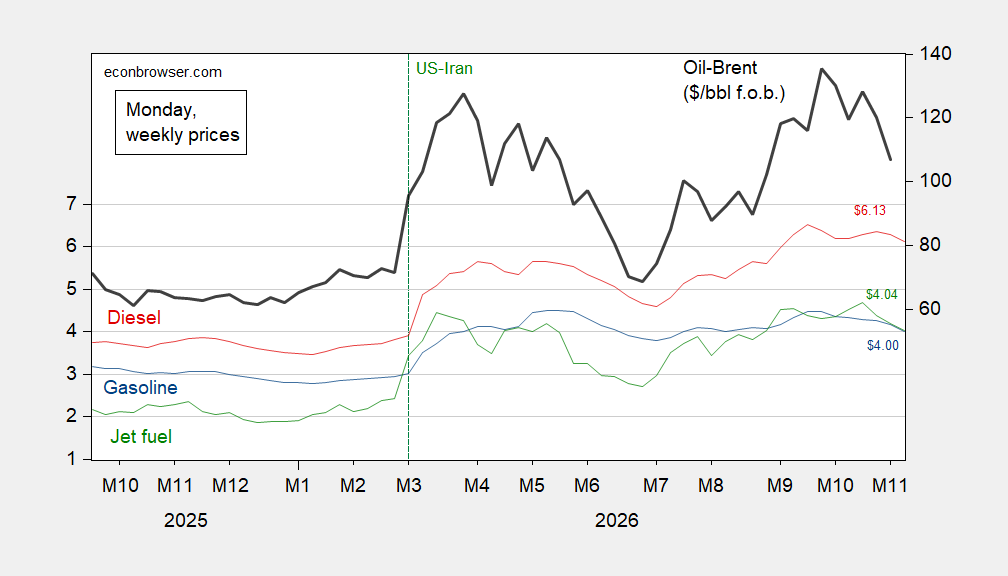
Prices on Monday: Figure 1: Regular gasoline (blue), diesel (red), jet fuel (green) all $/gal. on left log scale, and Brent $/bbl f.o.b. (bold black, right log scale). Source: EIA via FRED, EIA.
E
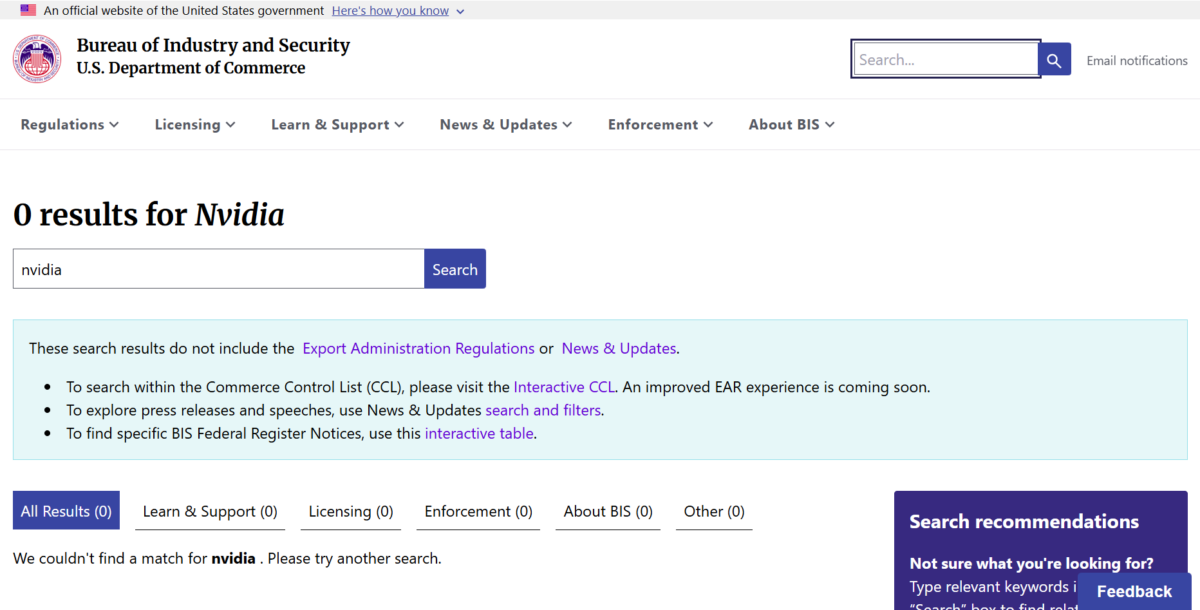
If you were curious: Source: Commerce/BIS, accessed 11/12/2026, 1:45PM CST.
E
CEA Chair Phelan on the need for a 50 bps increase in the Fed funds rate, given the hot CPI readings today, contra Waller and Logan (Bloomberg): Christopher Phelan, chairman of the White House Council of Economic Advisers and a former adviser to the Minneapolis Fed, said there’s no case for a half-percentage point move in December. “I’ve always followed the Revolutionary War doctrine of don’t shoot until you see the whites in their eyes,” Phelan told Bloomberg Television. “The whites in their…
E
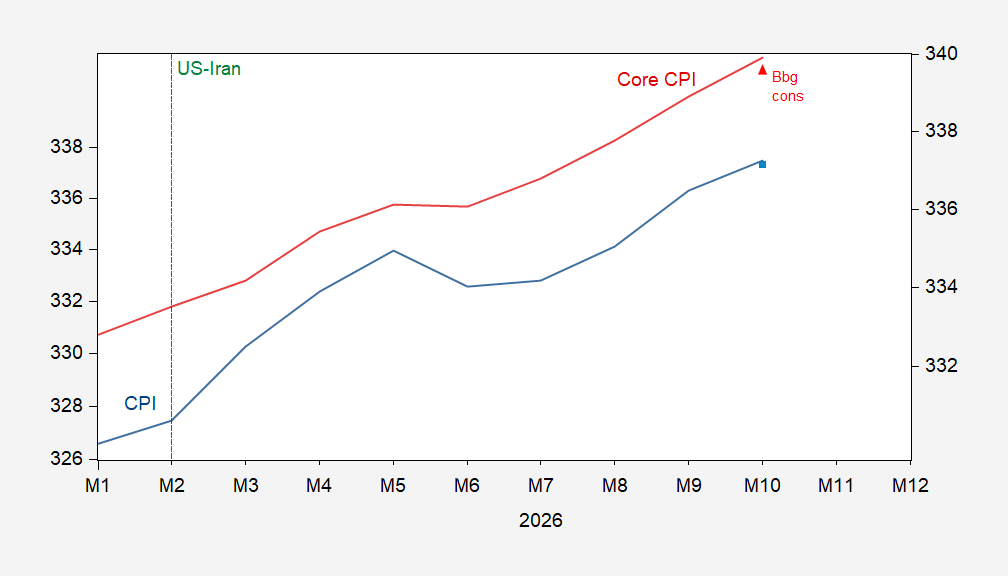
High relative to Bloomberg consensus , +0.4% vs. +0.3% m/m for headline, +0.3 vs. +0.2% for core: Figure 1: CPI (blue, left scale), Bloomberg consensus (light blue square, left log scale), core CPI (red, right log scale), Bloomberg consensus (red triangle, right log scale), 1982-84=100. Source: BLS, Bloomberg. How do the various measures compare? Figure 2: CPI (bold black, ) CPI wage (red), CPI chained n.s.a. (green), CPI ex-shelter (orange), PCE deflator (purple), PPI (teal), S&P Global GDP…
E
Theodore Roosevelt CSG en route, Boxer ARG nearing the region: Source: USNI.
E
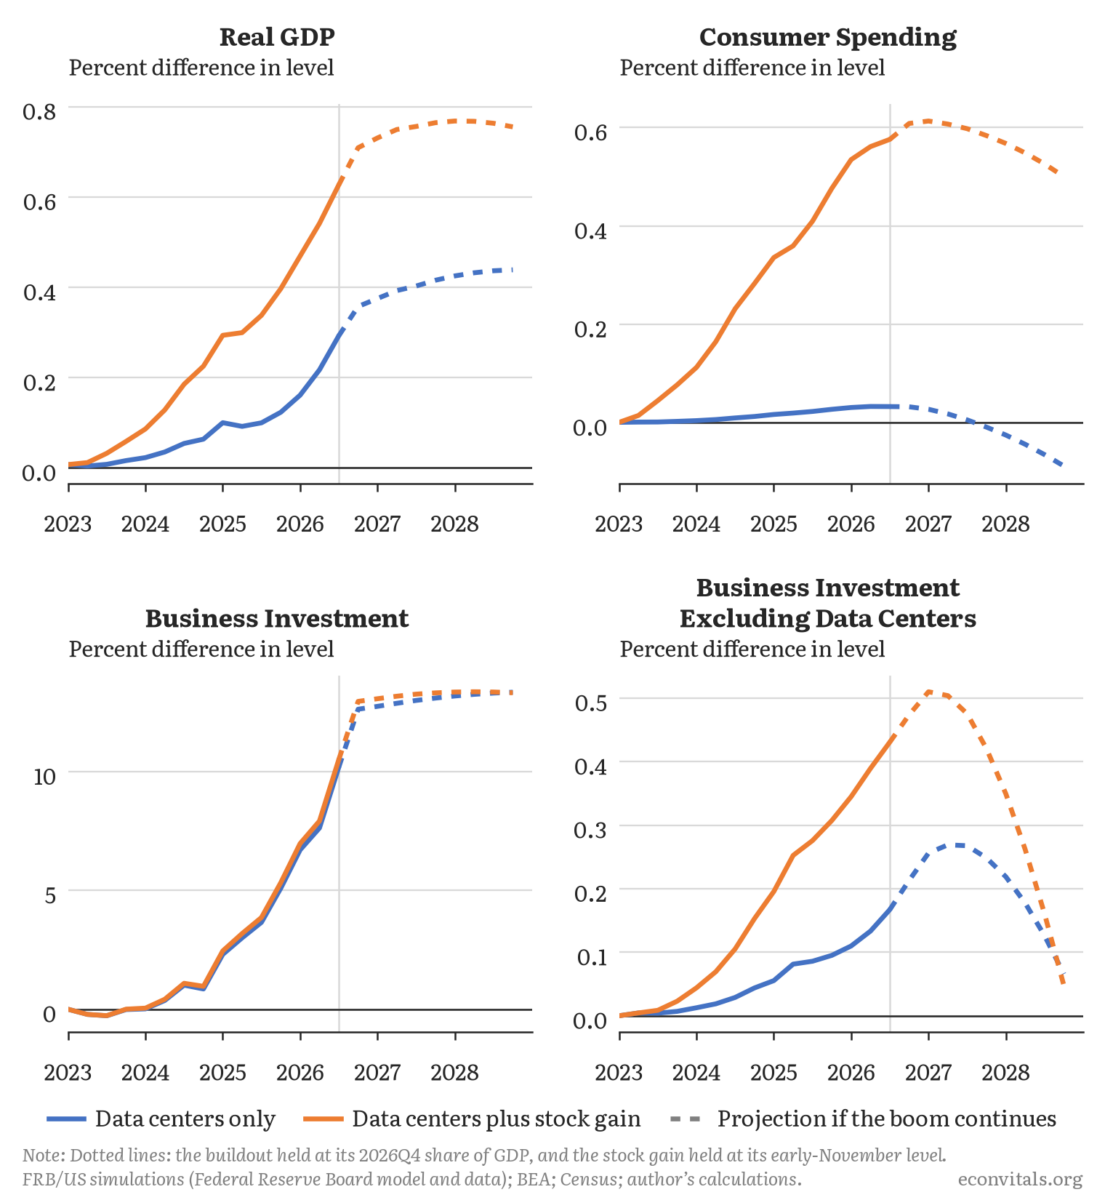
Jason Furman has put up a macro simulator based on the FRB/US model. Today, he traces out the model’s implications regarding the AI boom. The entire piece is a must read for those desiring a more general equilibrium view of the story. For now, here are a few graphs of four critical variables.
E
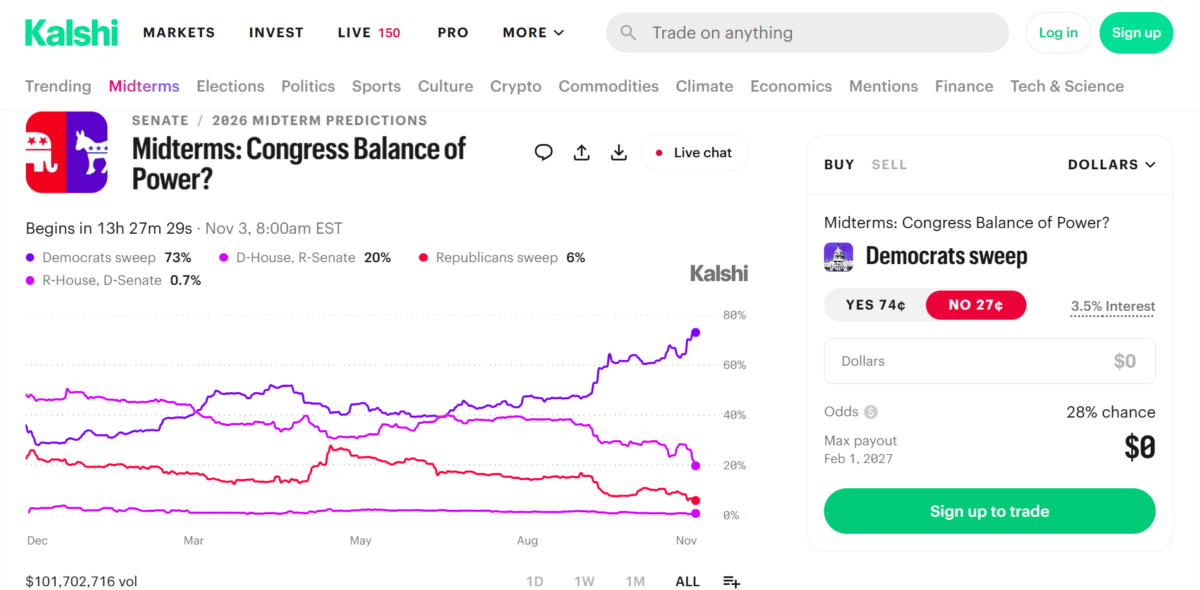
Today, in “Democrats Promised to Fix the Economy. What Can They Really Do?” (WSJ), Grossman, Whalen and Bade argue that Democrats can do very little to lower the cost of living. Whether they can [make the economy work] isn’t assured, despite the party’s pending control of the House and Senate. Many demands are beyond the reach of lawmakers to fix. The main tools of Congress, taxes and spending, are limited and slow-moving—and lawmakers still face Trump’s veto. The new majority may struggle to…
E
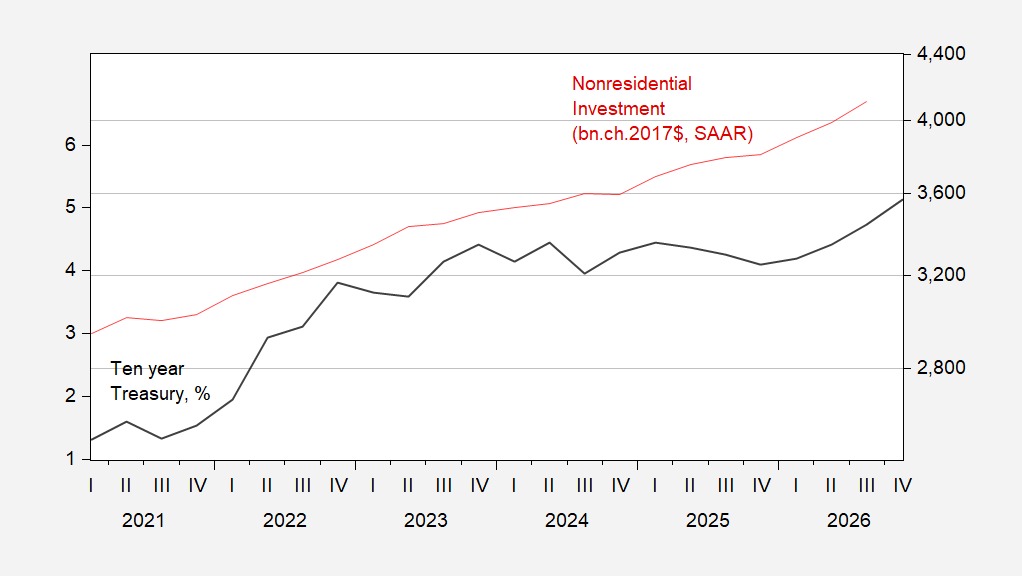
Aggregate nonresidential investment has surged despite elevated interest rates. The aggregate conceals the mixed. Figure 1: Ten year Treasurys, % (black,left scale), nonresidential fixed investment, bn.Ch.2017$ SAAR (red, right log scale). Source: Treasury, BEA. Components related to the AI boom have continued to grow relatively unabated: Figure 2: Ten year Treasurys, % (black,left scale), information equipment and software investment, bn.Ch.2017$ SAAR (green, right log scale),information…
E
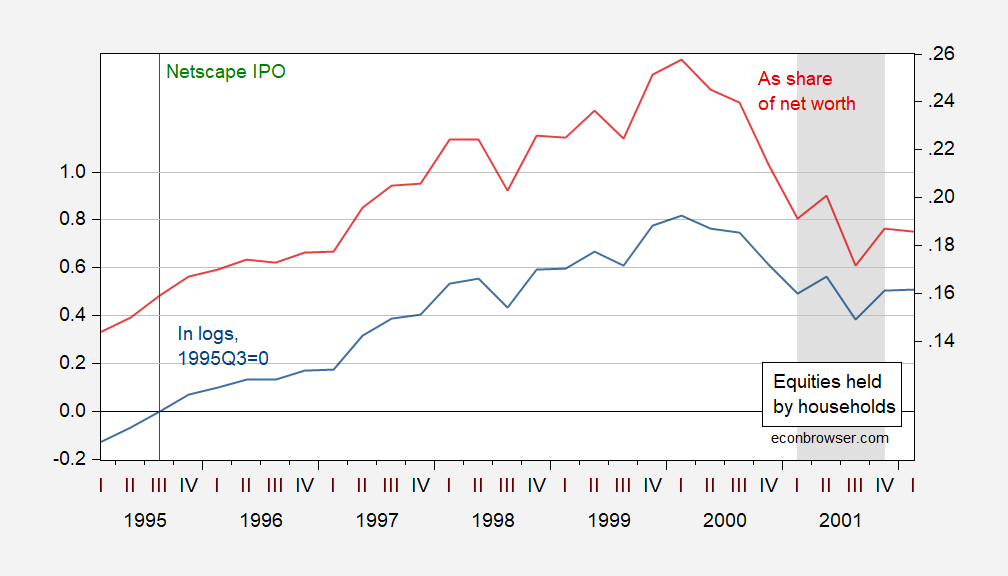
Estimates for 2026Q2, Q3, compared to 2000. Figure 1: PCE deflated equities and mutual funds held by households, in logs 1995Q3=0 (blue, left scale), equities and mutual funds held by households as a share of net worth (red, right scale). NBER defined peak-to-trough recession dates shaded gray. Source: Board of Governors of Federal Reserve, Flow of Funds, BEA, NBER and author’s calculations. Figure 2: PCE deflated equities and mutual funds held by households, in logs 1995Q3=0 (blue, left…
E
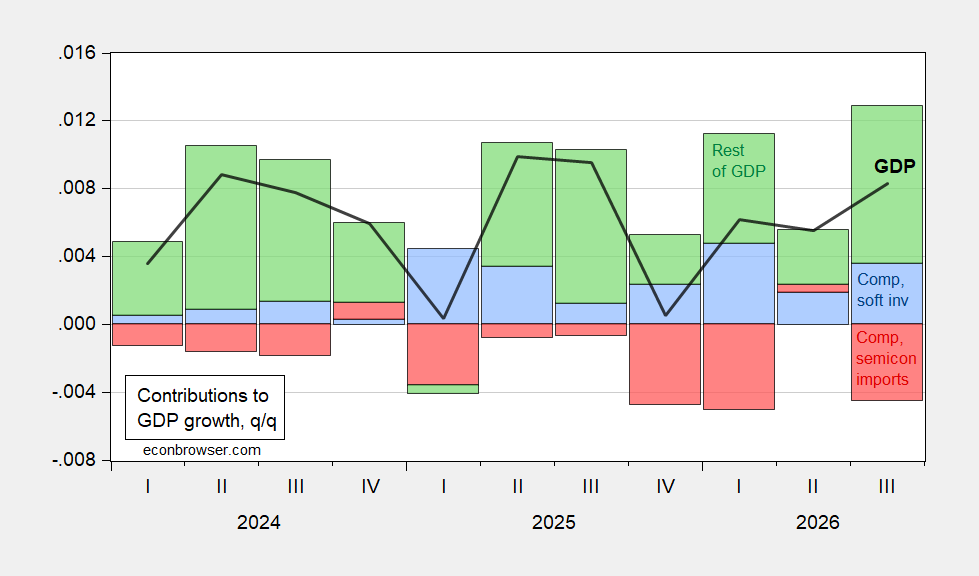
Suppose the AI capital investment boom recedes as asset valuations deflate. Some thoughts on implications. First, as has been well discussed, the capital investment surge is offset — in terms of GDP — to a large extent by imports. In an accounting sense, this is shown in Figure 1. Figure 1: Quarter on Quarter GDP growth (black line), contributions to quarter on quarter GDP growth from computer and software investment (blue bar), from imports of computers, peripherals, and semiconductors (red…
E
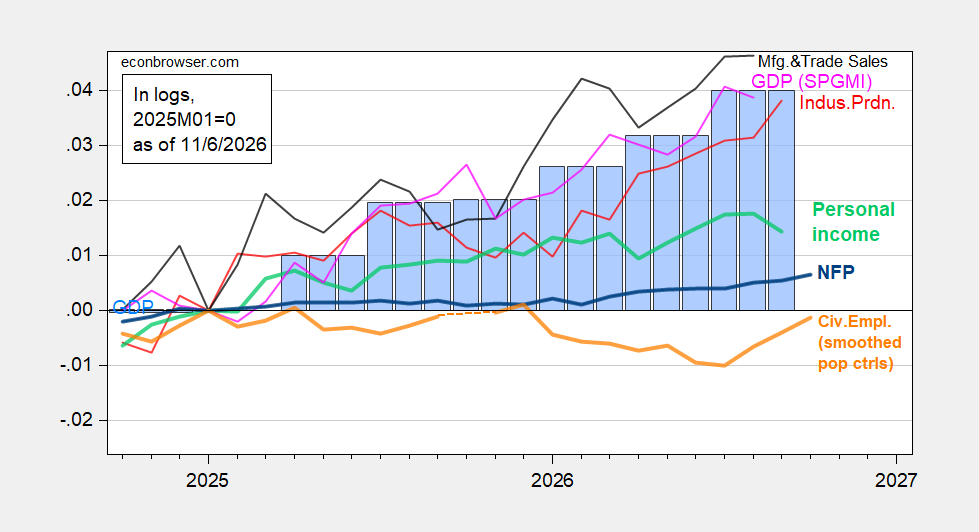
Key indicators followed by the NBER Business Cycle Dating Committee, as well as alternative indicators: Figure 1: NFP employment (bold blue), civilian employment with smoothed population controls (bold orange), industrial production (red), personal income excluding current transfers in Ch.2017$ (bold light green), manufacturing and trade sales in Ch.2017$ (black), and monthly GDP in Ch.2017$ (pink), GDP (blue bars), all log normalized to 2025M01=0. Source: BLS via FRED, BLS, Federal Reserve,…
E
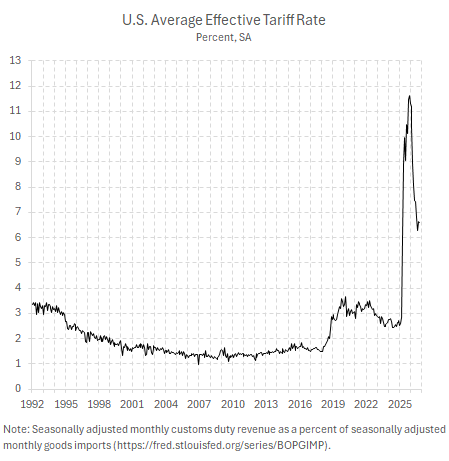
It would be hard to reduce the relevant price level and financing costs, but one could drop the price below the current policy trajectory (based upon this post). Ignoring political feasibility, it’s still useful to know what economic theory and empirics would say works. Reduce tariffs. Reopen the Strait of Hormuz, Strait of Bab al Mamdab, reduce shipping insurance costs Increase legal immigration Reduce removals of undocumented immigrants Decrease the trend in the budget deficit Rescind…
E
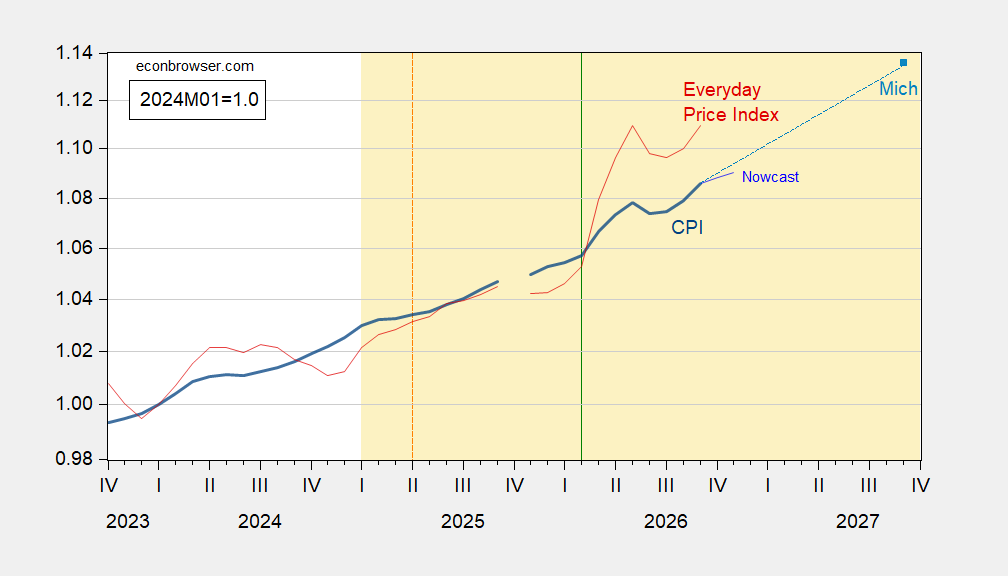
Note that CPI growth accelerates post tariffs, but most profoundly, post-war. Health premiums under ACA have risen. Figure 1: CPI (blue), Cleveland Fed nowcast of 11/4 (blue), implied CPI from Michigan year ahead expectations (light blue square), AIER Everyday Price Index (red), all 2024M01=1.00. Orange vertical line at “Liberation Day”; Vertical green line at start of US-Iran war. Source: BLS, Cleveland Fed, U.Michigan, American Institute for Economic Research, and author’s calculations.…
E
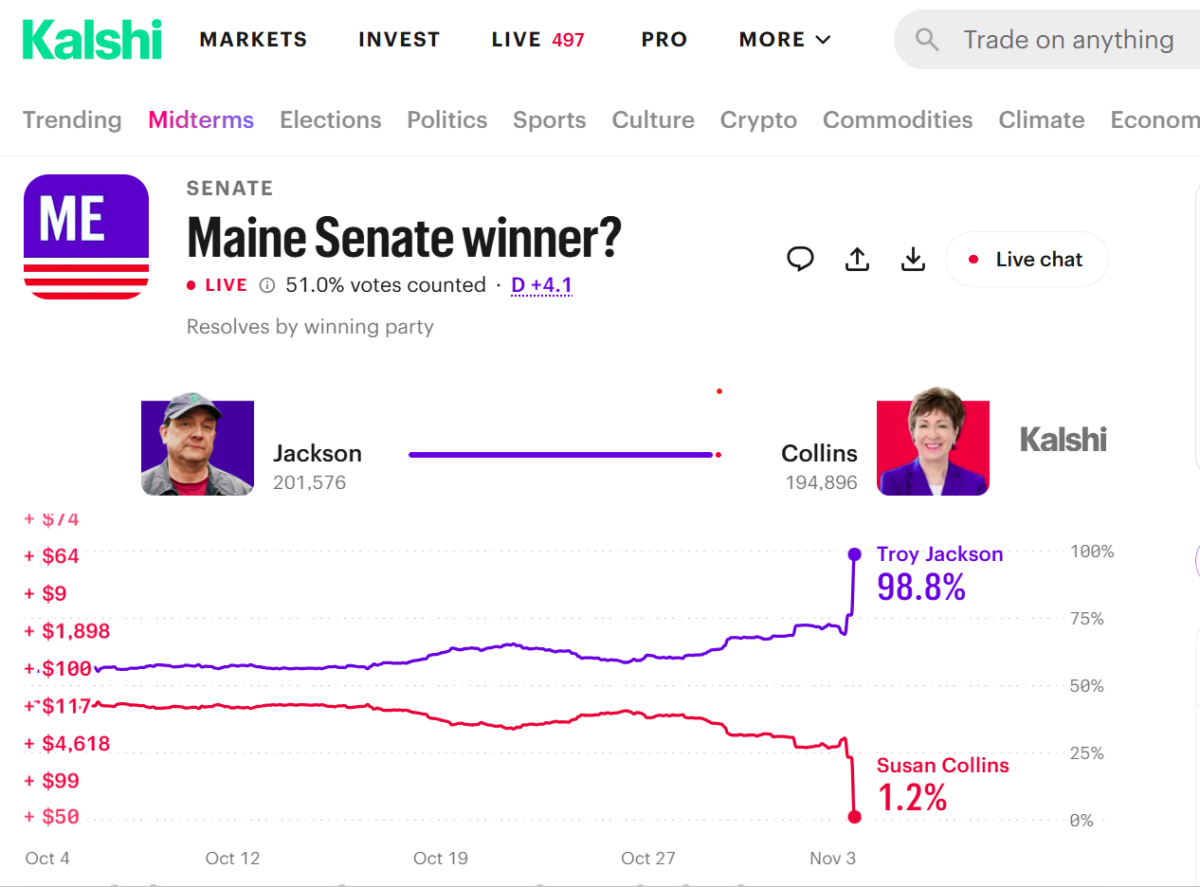
Odds for Jackson, when 56% vote in, 50.8% vs 49%.
E
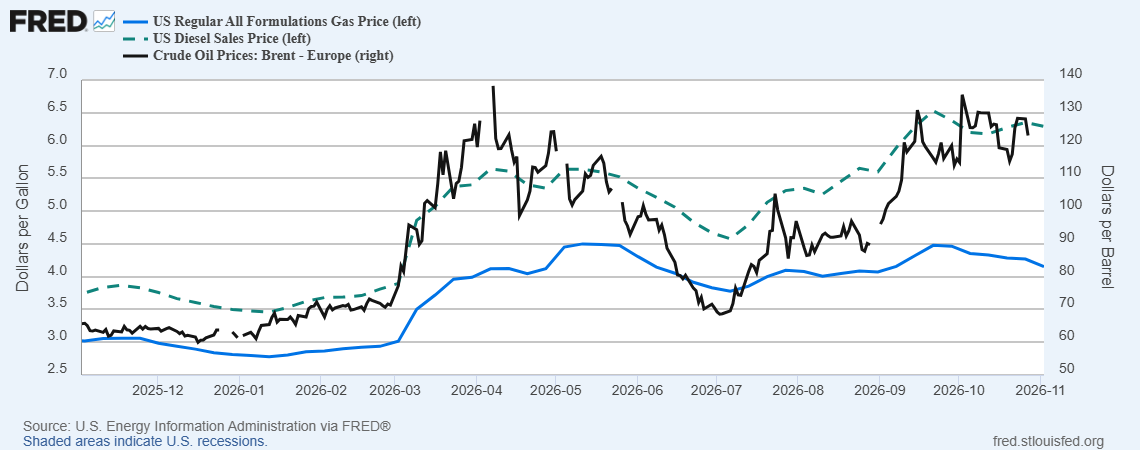
As of yesterday, from EIA via FRED:
E
New strikes on Iran tonight, from WSJ: The assault follows comments by Trump playing down the possibility of a return to war with Iran after Tuesday’s midterm elections. “We had a war with Iran. We won,” Trump told reporters Monday. “I don’t know if you even call it a war because we haven’t been doing any fighting for months.” But the U.S. has been engaged in smaller-scale strikes against Iran for several weeks, officials said, with explosions reported around Qeshm island on Monday on social…
E
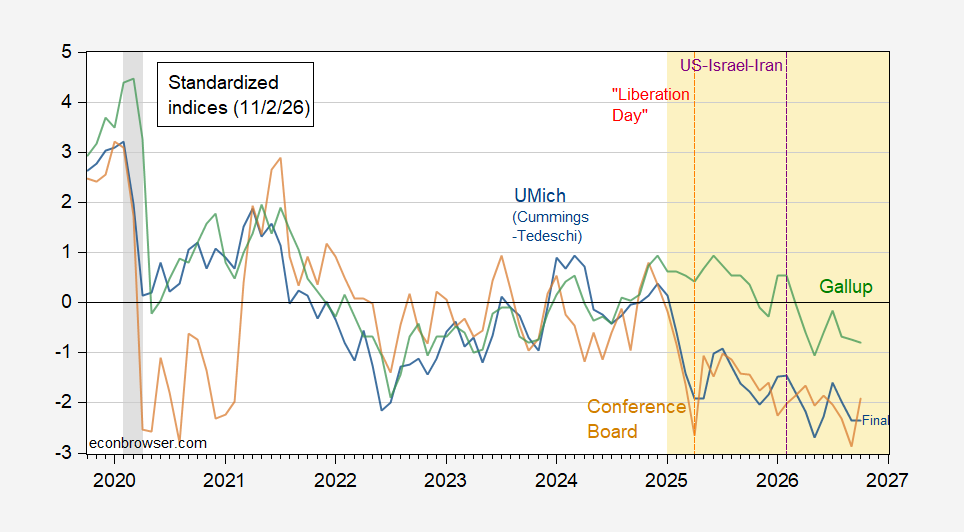
Decline in Gallup’s October reading. Figure 1: U.Michigan Economic Sentiment, using Cummings Tedeschi adjustment (blue), Conference Board Confidence Index (brown), Gallup Confidence (green), all demeaned and divided by standard deviation 2021M01-2025m02. Red dashed line at “Liberation Day”, purple dashed line at US-Iran war. Source: UMichigan, Gallup, Conference Board, Cummings and Tedeschi (2024), and author’s calculations. See more on sentiment from Jared Bernstein.
E
From USNI: CSIS on the military options available to the US.
E
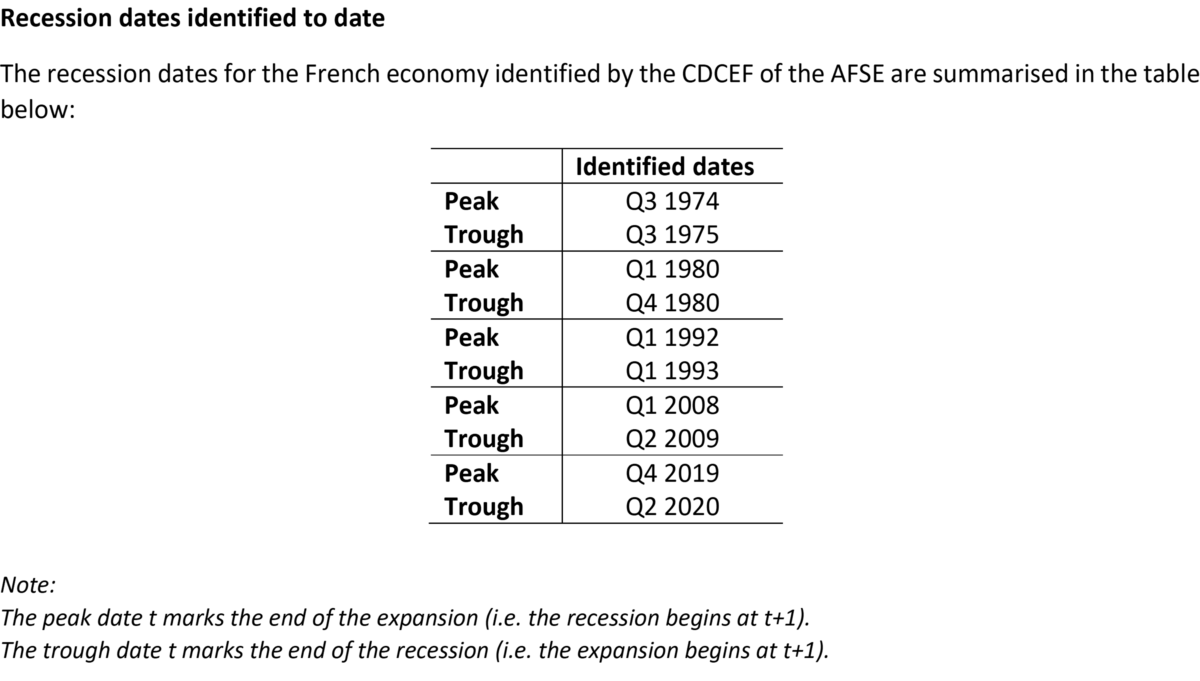
A statement by the French Business Cycle Dating Committee (CDCEF) of the French Economic Association (AFSE) on 10/29/2026 (original communique in French), by way of Laurent Ferrara (Chair), and secretariatafse@gmail.com. The quarterly growth rate of French GDP just released by the National Statistical Institute (Insee) for the third quarter of 2026 stands at −0.1%. This follows a contraction of 0.2% in the first quarter of 2026 and stagnation in the second quarter. According to some economic…
E
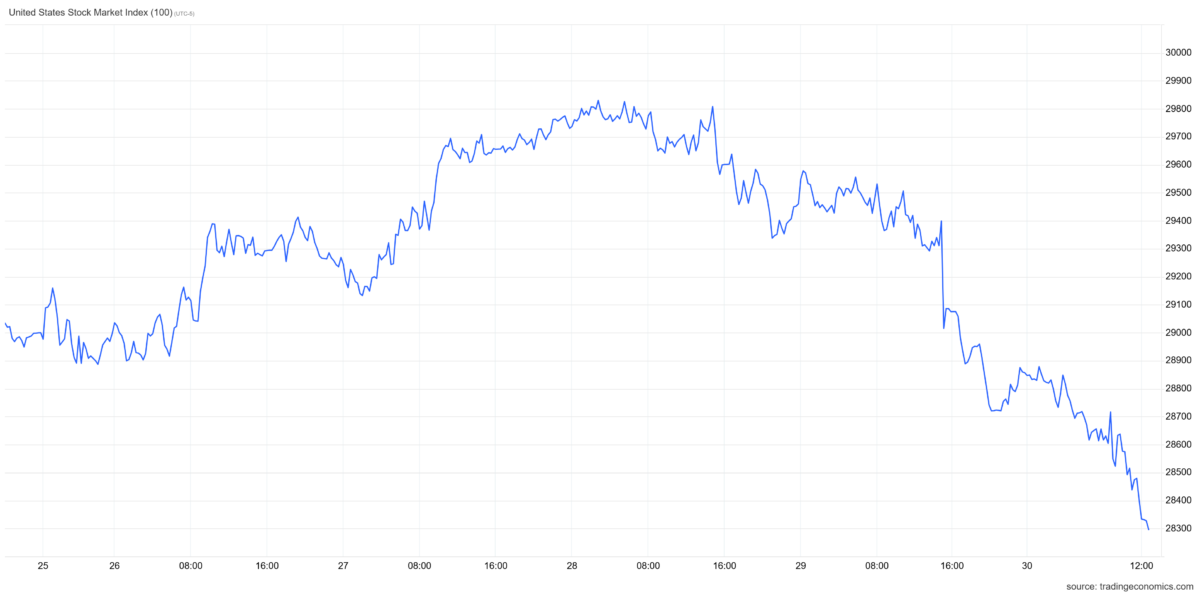
Nasdaq, SP500, Bloomberg Magnificent 7 index, over the last week. Bloomberg on the turmoil.
E
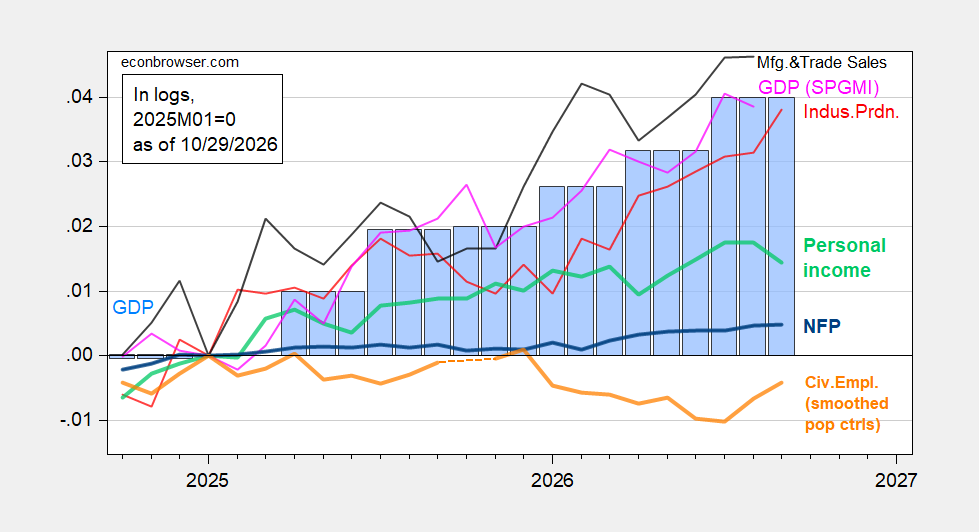
GDP is up as Jim discussed. Consumption flat, personal income ex-transfers down. Nominal consumption and income both below consensus by 0.1% m/m. Figure 1: NFP employment (bold blue), civilian employment with smoothed population controls (bold orange), industrial production (red), personal income excluding current transfers in Ch.2017$ (bold light green), manufacturing and trade sales in Ch.2017$ (black), and monthly GDP in Ch.2017$ (pink), GDP (blue bars), all log normalized to 2025M01=0.…